. 2007 Jun 4;177(5):927-39.
doi: 10.1083/jcb.200612058.

uPAR-induced cell adhesion and migration: vitronectin provides the key

Affiliations

uPAR-induced cell adhesion and migration: vitronectin provides the key

Chris D Madsen et al. J Cell Biol. .

Abstract

Expression of the membrane receptor uPAR induces profound changes in cell morphology and migration, and its expression correlates with the malignant phenotype of cancers. To identify the molecular interactions essential for uPAR function in these processes, we carried out a complete functional alanine scan of uPAR in HEK293 cells. Of the 255 mutant receptors characterized, 34 failed to induce changes in cell morphology. Remarkably, the molecular defect of all of these mutants was a specific reduction in integrin-independent cell binding to vitronectin. A membrane-tethered plasminogen activator inhibitor-1, which has the same binding site in vitronectin as uPAR, replicated uPAR-induced changes. A direct uPAR-vitronectin interaction is thus both required and sufficient to initiate downstream changes in cell morphology, migration, and signal transduction. Collectively these data demonstrate a novel mechanism by which a cell adhesion molecule lacking inherent signaling capability evokes complex cellular responses by modulating the contact between the cell and the matrix without the requirement for direct lateral protein-protein interactions.


Figures

Figure 1.
Figure 1.
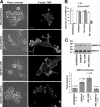
Expression of uPAR in 293 cells induces changes in cell morphology, actin cytoskeleton, signal transduction, and cell migration. (A) uPAR-induced changes in cell morphology and F-actin cytoskeleton. 293 cells transfected with a vector expressing human uPAR (293/uPAR) or empty vector (293/mock) were analyzed by phase-contrast microscopy (left panels) and by TIR-FM after fixation and staining with phalloidin-FITC (right panels). Bar, 10 μm. (B) uPAR expression induces basal cell migration. Cell migration speed was quantified using manual cell tracking of 293/mock and 293/uPAR cells monitored for 30 min (1 frame every 15 s) by phase-contrast time-lapse recordings. The entire time-lapse movie, including overlay tracking, is Video 1 (available at http://www.jcb.org/cgi/content/full/jcb.200612058/DC1). The number (n) of independent experiments in the dataset is indicated. The significance levels are indicated and refer to comparisons with mock-transfected cells. (C) uPAR-induced ERK1/2 activation. Semi-confluent 293/mock and 293/uPAR cells were serum starved for 4 h before cell lysis and Western blotting analysis. Blots were first probed for phosphorylated ERK1/2 (top blot) then stripped and reprobed for total ERK1/2 (bottom blot). The graph shows the mean ± SEM increase in the ratio between phosphorylated and total ERK/1/2 induced by uPAR expression. The number (n) of independent experiments in the dataset is indicated. The significance levels are indicated and refer to comparisons with mock-transfected cells.
Figure 2.
Figure 2.
uPAR induces RGD-independent cell adhesion to vitronectin and RGD-dependent changes in cell morphology and signal transduction. (A) uPAR promotes cell adhesion to the SMB domain of Vn. Schematic representation of the recombinant Vn fragments used in this study (left). Adhesion of uPAR and mock-transfected 293 cells were assayed by allowing cells to adhere for 30 min at 37°C to plates coated with the different substrates as indicated. The adhesion is shown as the percentage of adhesion to poly-l-lysine–coated wells. Values represent the mean ± SEM of independent assays each done in quadruplicate. The number (n) of independent experiments is indicated. (B) RGD-dependent changes in cell morphology. Phase-contrast images of 293/mock and 293/uPAR cells seeded in serum-free medium on Vn(1–66) and Vn(1–66)RAD for 2 h at 37°C. Bar, 10 μm. (C) RGD-dependent ERK1/2 activation. Serum-starved 293/uPAR cells were seeded on plates coated with Vn(1–66) or Vn(1–66)RAD for 30 min. The medium was aspirated and the cell lysates prepared and analyzed by Western blotting for ERK1/2 activation as in Fig. 1. Graph indicates the mean ± SEM. The number (n) of independent experiments in the dataset is indicated. The significance levels are indicated and refer to comparisons with mock-transfected cells.
Figure 3.
Figure 3.
The ability of uPAR to induce changes in cell morphology requires a direct Vn interaction. (A) Adhesion to Vn(1–66)RAD of cells expressing uPAR single alanine substitution mutants, which completely (Mutant morph.) or partially (Intermediate morph.) fail to induce changes in 293 cell morphology. Four mutants that induced normal uPAR-like changes in cell morphology (uPAR morph.) were included in the analysis for comparison. The data are presented as the mean ± SEM of three independent experiments, each performed in quadruplicate as described in Fig. 1. (B) Correlation between cell morphology and cell adhesion to Vn(1–66)RAD. Summary of the level of cell adhesion to Vn(1–66)RAD as grouped by the mutants ability to induce morphology changes. The number (n) of uPAR mutants in each morphological group is indicated. Data are presented as means ± SEM. (C) Adhesion to Vn(1–66)RAD as shown in panel A but with the adhesion conducted in the presence of 10 nM pro-uPA. (D) Identification of the direct Vn-binding epitope using purified proteins. Soluble uPAR variants of the mutant receptors were tested for their ability to bind immobilized Vn. The mutants are arranged according to the position in the uPAR sequence. The data are presented as the mean ± SEM of three independent experiments each performed in triplicate. (E) Location of the Vn-binding site on the crystal structure of uPAR. A surface representation of the uPAR structure is shown in gray, and the positions of the alanine-substituted residues that cause a strong reduction in Vn binding using purified proteins are indicated in red. For comparison, a series of residues located in the uPAR ligand binding cavity and known to be involved in uPA binding are indicated in yellow. The most C-terminal residue (Q279) that is likely to be located close to the GPI anchor of membrane-tethered uPAR is indicated in cyan. The left panel is a “front” view of the uPA-binding cavity (Llinas et al., 2005) and the right panel is a “top” view (front view rotated 90° toward the observer). The images were constructed using the coordinates deposited in the Protein Data Bank (PDB) with the code number 1YWH and the MacPyMOL software (http://pymol.sourceforge.net).
Figure 4.
Figure 4.
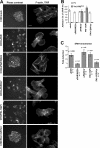
A GPI-anchored PAI-1 chimeric molecule mimics uPAR function. (A) Analysis of cell morphology (left panels) and F-actin cytoskeleton (right panels) of 293 cells expressing uPAR mutants with deficient Vn binding (W32A), integrin interaction deficient (Int) or the GPI-anchored PAI-1 molecule (PAI-1/GPI), and PAI-1/GPI molecule deficient in Vn binding (PAI-1/GPI/Vn) were analyzed as described in Fig. 1. Bar, 10 μm. (B) Adhesive properties of 293 cells expressing uPAR/W32A, uPAR/Int, PAI-1/GPI, and PAI-1/GPI/Vn. Data are presented as the mean ± SEM of three independent experiments performed in quadruplicate as described in Fig. 1. (C) ERK1/2-activation of 293 cells expressing uPAR/W32A, uPAR/Int, PAI-1/GPI, and PAI-1/GPI/Vn. Serum-starved cells were analyzed for ERK1/2 activation as described in Fig. 1. A representative immunoblot is shown and the quantification of (n) independent experiments is graphed as the mean ± SEM. Significance levels are indicated and refer to comparisons with mock-transfected cells analyzed in parallel.
Figure 5.
Figure 5.
A direct uPAR–Vn interaction is required and sufficient to induce changes in cell morphology, actin cytoskeleton, and signaling of CHO cells. (A) Cell morphology (left panels) and F-actin cytoskeleton (right panels) of CHO cells transfected with empty vector (mock), wild-type uPAR, the indicated uPAR mutants, and PAI-1/GPI constructs were analyzed as described in Fig. 1. Bar, 10 μm. (B) Adhesive properties of CHO cells transfected as in A. Data are shown as the mean ± SEM of three independent assays each done in quadruplicate as described in Fig. 2. (C) ERK1/2 activation in CHO cells. Cells were serum starved overnight and analyzed for ERK1/2 activation as described in Fig. 1. The graph indicates the mean ± SEM of (n) independent experiments. The significance levels are indicated and refer to comparisons with mock-transfected cells.
Figure 6.
Figure 6.
A direct uPAR–Vn interaction is responsible for uPA-induced ERK1/2 activation, lamellipodia formation, and cell scattering. (A) Adhesion to Vn(1–66)RAD of CHO cells transfected as indicated were assayed in the absence or presence of 10 nM pro-uPA. Data are shown as the mean ± SEM of three independent assays each done in quadruplicate. (B) ERK1/2-activation by uPA. CHO cells transfected as above were serum starved overnight and incubated for 10 min with 10 nM pro-uPA or left untreated. After cell lysis the levels of ERK1/2 activation was quantified as described in Fig. 1. Data are shown as the mean ± SEM of (n) independent experiments. The significance levels are indicated and refer to comparisons between with and without pro-uPA treatment. (C) Turnover of focal contacts induced by Vn engagement of uPAR. CHO cells expressing uPAR mutants W32A and T54A were transfected with a construct encoding GFP-tagged paxillin to label focal contact. Time-lapse recordings of paxillin distribution by TIR-FM were started immediately after the addition of 10 nM pro-uPA and continued for 15 min at 4 frames/min. The panel shows the first (t = 0 min) and last (t = 15 min) frames of representative recordings. The entire movie is Video 2 (available at http://www.jcb.org/cgi/content/full/jcb.200612058/DC1). (D) Epithelial–mesenchymal transition-like scattering of CHO cell colonies induced by Vn engagement of uPAR. CHO cells expressing the W32A and T54A receptors were plated at low density and allowed to form colonies for 4 d. Phase-contrast time-lapse recordings were started immediately after addition of 10 nM pro-uPA and continued for 24 h (1 frame every 5 min). The panel shows the first (t = 0 h) and the last (t = 24 h) frames of representative recordings. The entire time-lapse movie is Video 3 (available at http://www.jcb.org/cgi/content/full/jcb.200612058/DC1). Bars, 10 μm.

References

    1. Aguirre Ghiso, J.A., K. Kovalski, and L. Ossowski. 1999. Tumor dormancy induced by downregulation of urokinase receptor in human carcinoma involves integrin and MAPK signaling. J. Cell Biol. 147:89–104. - PMC - PubMed
    1. Alfano, M., N. Sidenius, B. Panzeri, F. Blasi, and G. Poli. 2002. Urokinase-urokinase receptor interaction mediates an inhibitory signal for HIV-1 replication. Proc. Natl. Acad. Sci. USA. 99:8862–8867. - PMC - PubMed
    1. Barinka, C., G. Parry, J. Callahan, D.E. Shaw, A. Kuo, K. Bdeir, D.B. Cines, A. Mazar, and J. Lubkowski. 2006. Structural basis of interaction between urokinase-type plasminogen activator and its receptor. J. Mol. Biol. 363:482–495. - PMC - PubMed
    1. Blasi, F., and P. Carmeliet. 2002. uPAR: a versatile signalling orchestrator. Nat. Rev. Mol. Cell Biol. 3:932–943. - PubMed
    1. Chaurasia, P., J.A. Aguirre-Ghiso, O.D. Liang, H. Gardsvoll, M. Ploug, and L. Ossowski. 2006. A region in urokinase plasminogen receptor domain III controlling a functional association with alpha5beta1 integrin and tumor growth. J. Biol. Chem. 281:14852–14863. - PubMed

Publication types

MeSH terms

Substances