. 2007 Sep 15;110(6):1970-81.
doi: 10.1182/blood-2006-09-044776. Epub 2007 Jun 4.

A novel role for HMGB1 in TLR9-mediated inflammatory responses to CpG-DNA

Affiliations

A novel role for HMGB1 in TLR9-mediated inflammatory responses to CpG-DNA

Stanimir Ivanov et al. Blood. .

Abstract

CpG-DNA or its synthetic analog CpG-ODN activates innate immunity through Toll-like receptor 9 (TLR9). However, the mechanism of TLR9 activation by CpG-DNA remains elusive. Here we have identified HMGB1 as a CpG-ODN-binding protein. HMGB1 interacts and preassociates with TLR9 in the endoplasmic reticulum-Golgi intermediate compartment (ERGIC), and hastens TLR9's redistribution to early endosomes in response to CpG-ODN. CpG-ODN stimulates macrophages and dendritic cells to secrete HMGB1; in turn, extracellular HMGB1 accelerates the delivery of CpG-ODNs to its receptor, leading to a TLR9-dependent augmentation of IL-6, IL-12, and TNFalpha secretion. Loss of HMGB1 leads to a defect in the IL-6, IL-12, TNFalpha, and iNOS response to CpG-ODN. However, lack of intracellular TLR9-associated HMGB1 can be compensated by extracellular HMGB1. Thus, the DNA-binding protein HMGB1 shuttles in and out of immune cells and regulates inflammatory responses to CpG-DNA.


Figures

Figure 1
Figure 1
The DNA-binding protein HMGB1 is a CpG-DNA engaging factor released by macrophages in response to IFNγ. (A) Purification of HMGB1 as a CpG-DNA–binding protein. Raw264.7 cells (2.5 × 10⁶/mL) were treated with IFNγ (30 ng/mL) for 18 hours. Cell-free supernatants (50 mL) were slowly loaded (10 mL/hour) onto a single-stranded DNA-cellulose column pre-equilibrated with buffer A (20 mM Tris-Cl, pH 8.8, 50 mM NaCl, 1 mM EDTA, 1 mM DTT, 5% glycerol). After absorption, the column was washed sequentially with 150 mL buffer A and rinsed with 150 mL 0.1 M NaCl in buffer A. Proteins were recovered from the column by sequential elution with 0.5 and 2 M NaCl in buffer A. Fractions (1 mL) were dialyzed overnight against buffer B (5 mM KH2PO4/NaOH, pH 7.9, 10% glycerol). Of each fraction, 30 μL was loaded on a 10% SDS-PAGE and subsequently silver stained. Fractions 2, 3, and 4 that had peak protein content were pooled, diluted with buffer A at 0.16 M NaCl, and incubated with 0.1 mg biotinyl-1018 ODN for 30 minutes followed by incubation overnight at 4°C with 0.5 mL streptavidin-agarose beads. The beads were washed with buffer A containing 0.16 M NaCl, boiled, and loaded on a 10% SDS-PAGE, and proteins were detected by silver staining. All visible bands were excised and subjected to mass spectrometry. Several representative HMGB1 peptides are listed. (B) HMGB1 binds CpG-ODNs (1018, 1668, and D-19) preferentially over controls (1019, n-1668, and c-405). Mouse rHMGB1 (25 ng) or histone H2A (25 ng) was incubated in the absence (control) or presence of CpG-ODN-biotin (5 μg) for 60 minutes. ODNs were immunoprecipitated with streptavidin-agarose beads, washed, and subjected to immunoblot analysis (IB) with anti-HMGB1 antibody. The levels of unbound HMGB1 or H2A were estimated by collecting 5% of the supernatant from each precipitation reaction. The gray value of the pixel intensity (range, 1 to 250) of the respective protein bands is listed. Results represent 1 of 6 or 3 reproducible independent experiments for HMGB1 and H2A binding, respectively. (C) CD spectra of oligos 1018 and 1019 in the presence of increasing amounts of HMGB1. All spectra have been acquired at 20°C, 20 mM phosphate buffer, pH 7.0, 10 mM NaCl, with an initial DNA concentration of 10 μM. Traces from red to violet correspond to the spectra acquired by adding 0, 1, 2, 2.8, 4.5, or 10 μM protein to the oligo solutions. The spectra were corrected by subtracting the buffer and the protein, and compensating for dilution. The panel “HMGB1 alone” shows the spectra recorded for 0, 1, 2, 2.8, 4.5, or 10 μM protein (in the same buffer and in the absence of DNA), to show that corrections applied to the recorded spectra are neutral in the wavelength range considered here.
Figure 2
Figure 2
HMGB1 potentiates the cytokine response to CpG-ODNs. (A) CpG-ODN triggers the release of HMGB1. BMDCs (3 × 10⁶ cells/mL) and BMDMs (2 × 10⁶ cells/mL) were treated with CpG-ODN (10 μg/mL) for the indicated time periods. The medium bathing the cells (40 μL) was subjected to SDS-PAGE and immunoblotted (IB) with anti-HMGB1 or anti-LDH antibody. As a positive control, 2 μg macrophage whole cell lysates were used. Cell viability was determined by trypan blue exclusion. (B-D) Extracellular HMGB1 enhances induction of cytokines by CpG-DNA in a TLR9-dependent manner. Cells were seeded at 1 to 2.5 × 10⁵/well in a 96-well plate (in triplicate) and then treated with CpG-ODN, PGN, or LPS, or left untreated. The LPS inhibitor polymyxin B (10 μg/mL) was used in all treatments except LPS. (B) BMDMs were treated with CpG-ODN (10 μg/mL), LPS (0.2 or 1 μg/mL), or PGN (2.5 μg/mL) in the presence or absence of rHMGB1 (50 ng/mL), or left untreated for 24 hours. IL-6 secretion was assessed by ELISA (averages of triplicates ± SD). Experiments were replicated 3 times. (C) BMDCs were treated with CpG-ODN (10 nM to 1000 nM) in the presence or absence of rHMGB1 (1 μg/mL) or left untreated for 24 hours. Levels of IL-6, IL-12, and TNFα secretion were assessed by ELISA (averages of triplicates ± SD). Experiments were replicated 3 times. (D, upper panel) BMDMs from wild-type (wt), Tlr9−/−, or Myd88−/− mice were treated for 24 hours with LPS (0.2 μg/mL), CpG-ODN (10 μg/mL) plus or minus rHMGB1 (50 ng/mL), or rHMGB1 alone (50 ng/mL); IL-6 secretion was assessed by ELISA. Bars represent the average of 6 independent experiments done in triplicate plus or minus SD (**P < .001, Student t test). (D, lower panels) BMDCs from wt, Tlr4m, or Tlr2−/− mice were treated with LPS (0.1 μg/mL), PGN (10 μg/mL), or CpG-ODN (10 μg/mL) plus or minus rHMGB1 (50 ng/mL). IL-6 secretion was assessed by ELISA. (E) rHMGB1 does not effect CpG-ODN uptake by BMDCs. Cells were treated with CpG-ODN-Cy5 in the presence or absence of rHMGB1 (250 ng/mL) for 1 hour as indicated. Cells were trypsinized and Cy5-positive cells were determined by fluorescence-activated cell sorting (FACS) analysis. (F) TLR9 was immunoprecipitated from the lysates of WEHI-231 cells that were treated with CpG-ODN (10 μg/mL). The presence of CpG-ODN in the TLR9 immunoprecipitate (IP) was detected by PCR. Levels of immunoprecipitated TLR9 for each reaction were assessed by immunoblotting (IB). (G) rHMGB1 speeds up the formation of the CpG-ODNs/TLR9 complex. WEHI-231 cells were treated with CpG-ODN (10 μg/mL) alone or preincubated for 1 hour with rHMGB1 (50 ng). TLR9 was immunoprecipitated and the levels of CpG-ODN in the TLR9 complex were assessed by PCR.
Figure 3
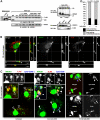
Figure 3
BMDMs contain vesicles rich in HMGB1 and TLR9, which participate in CpG-ODN recognition. (A) HMGB1 is associated with TLR9 prior to CpG-ODN treatment. Lysates from TLR9-deficient and wt splenocytes were used to identify the TLR9 band (left panel). WEHI-231 cells were treated with CpG-ODN (10 μg/mL), GpG-ODN (10 μg/mL), or peptidoglycan (PGN, 10 μg/mL) for the times indicated. HMGB1 was immunoprecipitated from cell lysates, and the presence of TLR9 or HMGB1 in the precipitated materials was detected by IB (left panel). Wt and TLR9-deficient splenocytes were treated with CpG-ODN (10 μg/mL) for the indicated time points or left untreated (top right panel). TLR9 was immunoprecipitated, and coprecipitation of HMGB1 with TLR9 was determined by IB. Whole-cell lysates from wt, HMGB1-deficient, and TLR9-deficient cells were probed by anti-HMGB1 and anti-TLR9 antibodies (bottom right panel). (B) Confocal microscopy of quiescent BMDMs reveals that HMGB1 and TLR9 colocalize in vesicular structures (indicated by triangles in z-stack images), which consistently appear close to the nucleus. Depth sections across 2 vesicles are shown in i-iv. Proteins were detected with anti-HMGB1/FITC and anti-TLR9/rhodamine. (C) BMDMs treated with CpG-ODN-Cy5 (1018, 5 μg/mL) as indicated were fixed, permeabilized, and stained with anti-TLR9/rhodamine and anti-HMGB1/FITC. △ indicate HMGB1/TLR9-containing vesicles; ▴ indicate CpG-DNA–containing vesicles. Solid arrows point to dispersed CpG-ODN-Cy5 staining in the tubular lysosomal compartment. (D) Quantification of the percentage of BMDMs containing at least one TLR9/HMGB1 vesicle. Cells were treated or not with CpG-ODN (1018, 5 μg/mL) in at least 3 independent experiments. Vesicles clearly visible within a single plane were counted.
Figure 4
Figure 4
The HMGB1/TLR9-containing vesicles colocalize with calnexin, GM130, and ERGIC-53, but lack lysosomal markers. (A) TLR9-containing vesicles accumulated the acidophilic fluorophore LysoTracker. BMDMs were treated with LysoTracker for 30 minutes prior to stimulation with CpG-ODNs (5 μg/mL), then fixed, permeabilized, and stained with anti-TLR9/FITC. Open triangles indicate representative vesicles. (B) BMDMs were stained with anti-HMGB1/FITC and anti-LAMP-1/rhodamine following stimulation with CpG-ODNs (5 μg/mL). △ indicate HMGB1-containing vesicles; ▴, CpG-DNA-containing vesicles; and ↑, tubular lysosomal compartment. (C-D) BMDMs were stained with anti-GM130/Alexa488 (C) or anti-calnexin/Alexa488 (D) and anti-TLR9/Alexa568 or anti-HMGB1/Alexa568, prior to or following stimulation with CpG-ODN-Cy5 (5 μg/mL) for 10 minutes. Confocal images were acquired by indirect immunofluorescence. Solid arrows indicate colocalization between GM130/calnexin and TLR9 or GM130 and HMGB1. Solid triangles indicate vesicles containing CpG-ODN-Cy5 as well as GM130 and TLR9 or HMGB1. Open triangles indicate vesicles containing HMGB1/TLR9 and CpG-ODN but lack calnexin or GM130. (E) Control staining of BMDMs with antimouse-Alexa568/antirabbit-Alexa568 and antigoat-Alexa488. (F) Percentages of vesicles containing CpG-ODNs alone, CpG-ODN in the presence of TLR9/HMGB1, or CpG-ODN in the presence of TLR9/HMGB1 and GM130 or calnexin. Vesicles were analyzed from 2 independent experiments. (G,H) Quiescent (G) or treated (H) BMDMs were stained with anti-ERGIC-53/Alexa488 and either anti-TLR9/Alexa568 or anti-HMGB1/Alexa568. Rectangular regions showing representative colocalization between ERGIC-53/TLR9 and ERGIC/HMGB1 (solid arrows) are magnified. Colocalization of CpG-ODNs with TLR9/HMGB1 in the presence or absence of ERGIC-53 is shown with solid or open triangles, respectively.
Figure 5
Figure 5
HMGB1 in vesicles is from the nucleus. (A) LMB inhibits HMGB1 translocation into TLR9-containing vesicles. BMDMs were incubated in the presence or absence of 20 ng/mL LMB for 45 minutes, followed by treatment with CpG-ODN-Cy5 (1018, 5 μg/mL). △ indicate HMGB1-containing vesicles; ▴, CpG-DNA-containing vesicles; and ↑, early CpG-DNA-containing vesicle prior to acquisition by HMGB1/TLR9-containing vesicles. (B) Quantitative analysis of the fluorescence of HMGB1 and TLR9 within vesicles over background fluorescence in BMDMs treated with or without 20 ng/mL LMB for 45 minutes (means ± SEM, n = 35, **P < .001, Student t test). (C) LMB impairs the formation of the TLR9-HMGB1 complex. HMGB1 was immunoprecipitated from lysates of WEHI-231 cells that were treated with 20 ng/mL LMB for 45 minutes prior to stimulation with CpG-ODN (10 μg/mL) for 30 minutes. (D) Exogenously added rHMGB1 can restore the presence of HMGB1 in the vesicles. rHMGB1 (25 ng/mL) was incubated with CpG-ODN-Cy5 (1018, 5 μg/mL) for 60 minutes and added to BMDMs treated with 20 ng/mL LMB for 45 minutes. ▴ indicate TLR9 extensively colocalized with CpG-DNA/HMGB1-containing vesicles. (E) Addition of rHMGB1 increases colocalization of HMGB1 with TLR9. Different amounts of rHMGB1 as indicated were incubated with wt and HMGB1-deficient macrophages (IFLMDs) for 10 minutes. Colocalization of TLR9 with HMGB1 was determined. (F) Translocation of HMGB1 into ERGIC-53–containing vesicles can be blocked by LMB and restored by exogenous rHMGB1. BMDMs were starved for 3 hours and then treated with LMB or left untreated for 60 minutes. Cells were incubated with CpG-ODN (10 μg/mL) or rHMBG1 (50 ng/mL) for 10 minutes in the presence or absence of LMB.
Figure 6
Figure 6
HMGB1 accelerates early endosomal translocation of TLR9 in macrophages in response to CpG-ODN. (A,B) Wt (top panels) and HMGB1-deficient (bottom panels) IFLDMs (A) or PFLDMs (B) were treated with CpG-ODN-Cy5 (1018, 5 μg/mL) for 0, 5, 15, or 30 minutes. Cells were fixed, permeabilized, and stained with anti-TLR9/FITC and anti-EEA1/rhodamine. Confocal images were acquired by indirect immunofluorescence.
Figure 7
Figure 7
Impaired CpG-ODN responses in Hmgb1−/− cells. (A) Wt and Hmgb1−/− immortalized or primary hematopoietic progenitor cells (HPCs) expressed the DC markers CD11b and CD11c following incubation with GM-CSF for 7 days, or expressed CD11b and F4/80 after culture with macrophage medium for 10 days. Although HPCs are uniformly round and nonadherent, following differentiation they become adherent and acquire a macrophage-like morphology. (IFLDCs indicates DCs derived from immortalized fetal liver. HPCs; PFLDCs, DCs derived from primary fetal liver HPCs.) (B) Protein levels of HMGB1, TLR9, and actin in wt and Hmgb1−/− IFLDCs. (C) Wt and Hmgb1−/− IFLDCs endocytosed comparable levels of CpG-ODN or GpG-ODN. Cells were treated with CpG-ODN-Cy5 (0.1 or 1.0 μg/mL for 1 hour, left panel), CpG-ODN-Cy5 (1018, 10 or 100 nM), or GpG-ODN-Cy5 (1019, 10 or 100 nM) for the indicated time points (right panel), and then subjected to FACS analysis. (D) Wild-type and Hmgb1−/− IFLDMs were seeded at 1 × 10⁵/well in a 96-well plate (in triplicate) and treated with CpG-ODN (1018, 10 to 1000 nM), LPS (0.1 μg/mL), or PGN (10 μg/mL). After 24 hours, IL-6 secretion was assessed by ELISA (bars represent the average of triplicates ± SD). Experiments were replicated 3 times. (E) Wt and Hmgb1−/− IFLDCs were seeded at 1 × 10⁵/well in a 96-well plate (in triplicate) and treated with CpG-ODN (1018, 1 to 1000 nM), LPS (0.1 μg/mL), or PGN (10 μg/mL). After 24 hours, IL-6, IL-12, and TNFα secretion was assessed by ELISA (bars represent the average of triplicates ± SD). Experiments were replicated 5 times. (F) Wt and Hmgb1−/− IFLDCs were seeded at 1 × 10⁵/well in a 96-well plate (in triplicate) and treated with CpG-A (2216, 1 to 1000 nM, top panel) or CpG-ODN (1018, 0.1 or 1.0 μg/mL, bottom panel) in the presence or absence of DOTAP (10 μg/mL), or LPS (0.01 or 0.1 μg/mL, bottom panel), or left untreated. After 24 hours, IL-12 (top panel) or IL-6 (bottom panel) secretion was assessed by ELISA (bars represent the average of triplicates ± SD). (G) Wt and Hmgb1−/− PFLDCs were seeded at 0.8 × 10⁵/well in a 96-well plate (in triplicate) and treated with CpG-ODN (1018, 100 or 1000 nM) or CpG-A (2216, 100 or 1000 nM) in the presence or absence of DOTAP (10 μg/mL), or LPS (0.1 μg/mL), or left untreated. After 24 hours, IL-6 and IL-12 secretion was assessed by ELISA (bars represent the average of triplicates ± SD). ND: not detected. (H) Wt and Hmgb1−/− IFLDCs were treated with CpG-B (1018, 10 μg/mL), CpG-A (2216, 3.3 μg/mL), and poly(I:C) (10 μg/mL) in the presence or absence of DOTAP (10 μg/mL) for 24 hours. Type 1 IFN bioactivity in supernatant samples was detected by a biologic assay against vesicular stomatitis virus. (I) Whole-cell lysates were prepared at 16 hours after treatment with CpG-ODN (1018, 10 μg/mL) or LPS (1 μg/mL) and the levels of iNOS, HMGB1, and actin were determined by IB. (n.s. = nonspecific band.) (J) Exogenous rHMGB1 restored cytokine production by Hmgb1−/− IFLDCs in response to CpG-ODN. rHMGB1 (rH1, 0.2 μg/mL) was incubated in the presence or absence of CpG-ODN (1018) for 15 minutes. Wt and Hmgb1−/− IFLDCs were treated with CpG-ODN (1018, 1 or 10 μg/mL) ± rHMGB1, LPS (0.1 μg/mL), or rH1 alone, or left untreated for 24 hours, and the levels of secreted IL-6 were determined by ELISA (bars represent the average of triplicates ± SD).

References

    1. Akira S, Takeda K, Kaisho T. Toll-like receptors: critical proteins linking innate and acquired immunity. Nat Immunol. 2001;2:675–680. - PubMed
    1. Takeda K, Kaisho T, Akira S. Toll-like receptors. Annu Rev Immunol. 2003;21:335–376. - PubMed
    1. Karlin S, Doerfler W, Cardon LR. Why is CpG suppressed in the genomes of virtually all small eukaryotic viruses but not in those of large eukaryotic viruses? J Virol. 1994;68:2889–2897. - PMC - PubMed
    1. Cardon LR, Burge C, Clayton DA, Karlin S. Pervasive CpG suppression in animal mitochondrial genomes. Proc Natl Acad Sci U S A. 1994;91:3799–3803. - PMC - PubMed
    1. Razin A, Friedman J. DNA methylation and its possible biological roles. Prog Nucleic Acid Res Mol Biol. 1981;25:33–52. - PubMed

Publication types

MeSH terms