

Availability of a diversely avid CD8+ T cell repertoire specific for the subdominant HLA-A2-restricted HIV-1 Gag p2419-27 epitope
- PMID: 17548613
- PMCID: PMC2365726
- DOI: 10.4049/jimmunol.178.12.7756
Availability of a diversely avid CD8+ T cell repertoire specific for the subdominant HLA-A2-restricted HIV-1 Gag p2419-27 epitope
Abstract
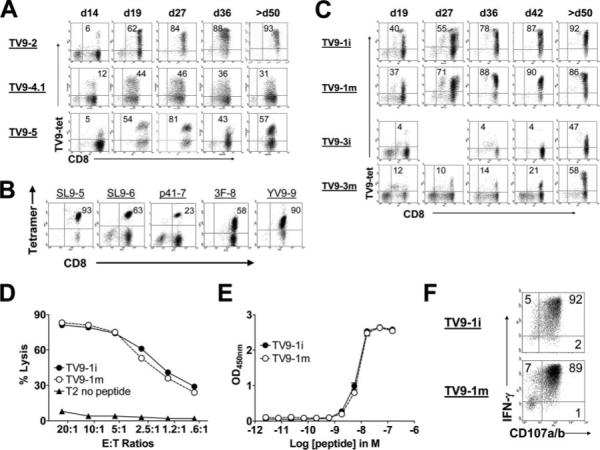
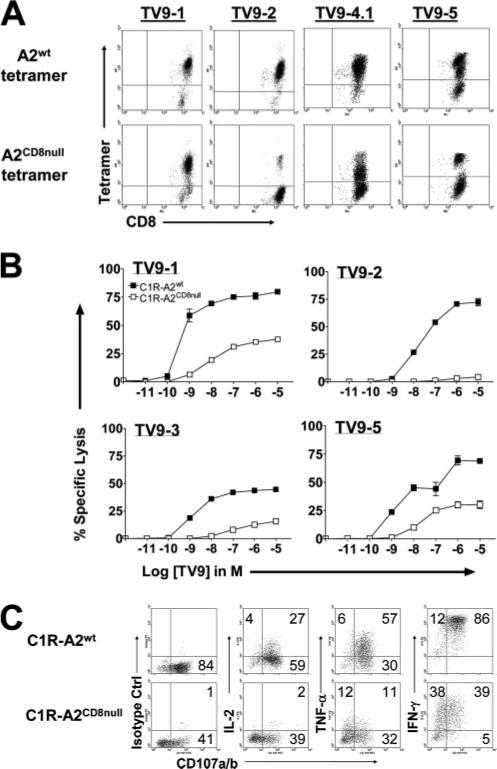
HLA-A2-restricted CTL responses to immunodominant HIV-1 epitopes do not appear to be very effective in the control of viral replication in vivo. In this study, we studied human CD8+ T cell responses to the subdominant HLA-A2-restricted epitope TV9 (Gag p24(19-27), TLNAWVKVV) to explore the possibility of increasing its immune recognition. We confirmed in a cohort of 313 patients, infected by clade B or clade C viruses, that TV9 is rarely recognized. Of interest, the functional sensitivity of the TV9 response can be relatively high. The potential T cell repertoires for TV9 and the characteristics of constituent clonotypes were assessed by ex vivo priming of circulating CD8+ T cells from healthy seronegative donors. TV9-specific CTLs capable of suppressing viral replication in vitro were readily generated, suggesting that the cognate T cell repertoire is not limiting. However, these cultures contained multiple discrete populations with a range of binding avidities for the TV9 tetramer and correspondingly distinct functional dependencies on the CD8 coreceptor. The lack of dominant clonotypes was not affected by the stage of maturation of the priming dendritic cells. Cultures primed by dendritic cells transduced to present endogenous TV9 were also incapable of clonal maturation. Thus, a diffuse TCR repertoire appeared to be an intrinsic characteristic of TV9-specific responses. These data indicate that subdominance is not a function of poor immunogenicity, cognate TCR repertoire availability, or the potential avidity properties thereof, but rather suggest that useful responses to this epitope are suppressed by competing CD8+ T cell populations during HIV-1 infection.
Figures


Similar articles
-
Generation of robust CD8+ T-cell responses against subdominant epitopes in conserved regions of HIV-1 by repertoire mining with mimotopes.Eur J Immunol. 2010 Jul;40(7):1950-62. doi: 10.1002/eji.200940079. Eur J Immunol. 2010. PMID: 20432235 Free PMC article.
-
The HIV-1 HLA-A2-SLYNTVATL is a help-independent CTL epitope.J Immunol. 2004 May 1;172(9):5249-61. doi: 10.4049/jimmunol.172.9.5249. J Immunol. 2004. PMID: 15100263
-
Sequence conservation of subdominant HLA-A2-binding CTL epitopes in HIV-1 clinical isolates and CD8+ T-lymphocyte cross-recognition may explain the immune reaction in infected individuals.APMIS. 2007 Jun;115(6):757-68. doi: 10.1111/j.1600-0463.2007.apm_595.x. APMIS. 2007. PMID: 17550385
-
Recognition patterns of HLA-A2-restricted human immunodeficiency virus-1-specific cytotoxic T-lymphocytes in a cohort of HIV-1-infected individuals.Viral Immunol. 2005;18(4):627-36. doi: 10.1089/vim.2005.18.627. Viral Immunol. 2005. PMID: 16359229
-
Efficient processing of the immunodominant, HLA-A*0201-restricted human immunodeficiency virus type 1 cytotoxic T-lymphocyte epitope despite multiple variations in the epitope flanking sequences.J Virol. 1999 Dec;73(12):10191-8. doi: 10.1128/JVI.73.12.10191-10198.1999. J Virol. 1999. PMID: 10559335 Free PMC article.
Cited by
-
Therapeutic Vaccines for the Treatment of HIV.Transl Res. 2020 Sep;223:61-75. doi: 10.1016/j.trsl.2020.04.008. Epub 2020 May 11. Transl Res. 2020. PMID: 32438074 Free PMC article. Review.
-
Identification and translational validation of novel mammaglobin-A CD8 T cell epitopes.Breast Cancer Res Treat. 2014 Oct;147(3):527-37. doi: 10.1007/s10549-014-3129-x. Epub 2014 Sep 12. Breast Cancer Res Treat. 2014. PMID: 25212176 Free PMC article. Clinical Trial.
-
Autologous HIV-1 clade-B Nef peptides elicit increased frequency, breadth and function of CD8+ T-cells compared to consensus peptides.PLoS One. 2012;7(11):e49562. doi: 10.1371/journal.pone.0049562. Epub 2012 Nov 19. PLoS One. 2012. PMID: 23185362 Free PMC article.
-
Rapid perturbation in viremia levels drives increases in functional avidity of HIV-specific CD8 T cells.PLoS Pathog. 2013;9(7):e1003423. doi: 10.1371/journal.ppat.1003423. Epub 2013 Jul 4. PLoS Pathog. 2013. PMID: 23853580 Free PMC article.
-
Epitope mapping of HIV-specific CD8+ T cells in a cohort dominated by clade A1 infection.PLoS One. 2009 Sep 11;4(9):e6965. doi: 10.1371/journal.pone.0006965. PLoS One. 2009. PMID: 19750221 Free PMC article.
References
-
- Letvin NL. Progress toward an HIV vaccine. Annu. Rev. Med. 2005;56:213–223. - PubMed
-
- Brander C, Frahm N, Walker BD. The challenges of host and viral diversity in HIV vaccine design. Curr. Opin. Immunol. 2006;18:430–437. - PubMed
-
- McMichael AJ. HIV vaccines. Annu. Rev. Immunol. 2006;24:227–255. - PubMed
-
- Phillips RE, Rowland-Jones S, Nixon DF, Gotch FM, Edwards JP, Ogunlesi AO, Elvin JG, Rothbard JA, Bangham CR, Rizza CR, et al. Human immunodeficiency virus genetic variation that can escape cytotoxic T cell recognition. Nature. 1991;354:453–459. - PubMed
-
- Borrow P, Lewicki H, Wei X, Horwitz MS, Peffer N, Meyers H, Nelson JA, Gairin JE, Hahn BH, Oldstone MB, Shaw GM. Antiviral pressure exerted by HIV-1-specific cytotoxic T lymphocytes (CTLs) during primary infection demonstrated by rapid selection of CTL escape virus. Nat. Med. 1997;3:205–211. - PubMed
Publication types
MeSH terms
Substances
Grants and funding
LinkOut - more resources
Full Text Sources
Research Materials
