. 2007 Jun 12;104(24):10175-80.
doi: 10.1073/pnas.0704170104. Epub 2007 Jun 4.

TORC2 regulates germinal center repression of the TCL1 oncoprotein to promote B cell development and inhibit transformation

Affiliations

TORC2 regulates germinal center repression of the TCL1 oncoprotein to promote B cell development and inhibit transformation

Ali I Kuraishy et al. Proc Natl Acad Sci U S A. .

Abstract

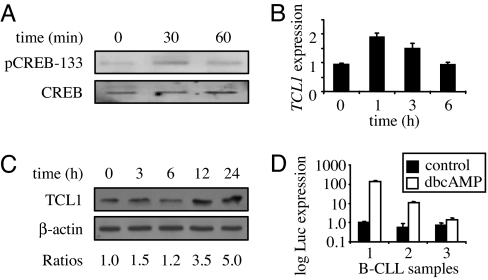
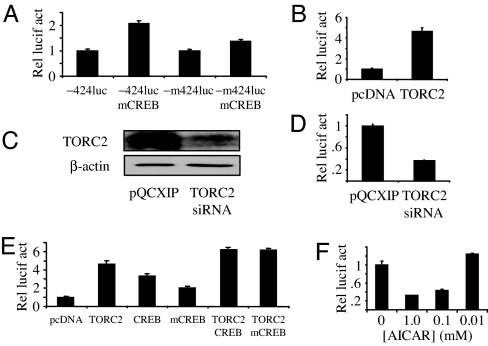
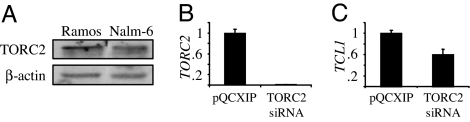
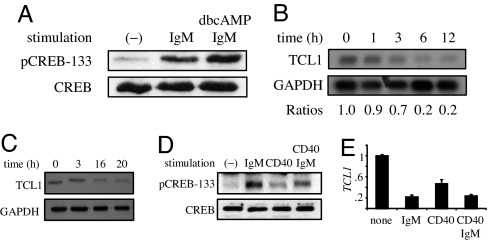
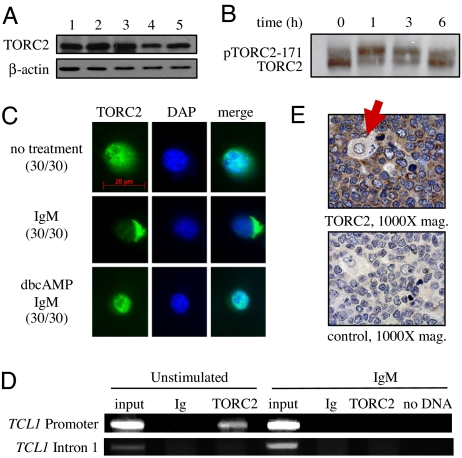
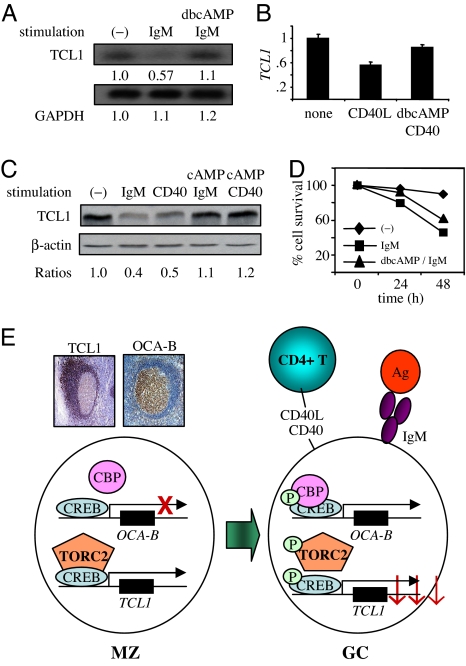
Aberrant expression of the TCL1 oncoprotein promotes malignant transformation of germinal center (GC) B cells. Repression of TCL1 in GC B cells facilitates FAS-mediated apoptosis and prevents lymphoma formation. However, the mechanism for this repression is unknown. Here we show that the CREB coactivator TORC2 directly regulates TCL1 expression independent of CREB Ser-133 phosphorylation and CBP/p300 recruitment. GC signaling through CD40 or the BCR, which activates pCREB-dependent genes, caused TORC2 phosphorylation, cytosolic emigration, and TCL1 repression. Signaling via cAMP-inducible pathways inhibited TCL1 repression and reduced apoptosis, consistent with a prosurvival role for TCL1 before GC selection and supporting an initiating role for aberrant TCL1 expression during GC lymphomagenesis. Our data indicate that a novel CREB/TORC2 regulatory mode controls the normal program of GC gene activation and repression that promotes B cell development and circumvents oncogenic progression. Our results also reconcile a paradox in which signals that activate pCREB/CBP/p300 genes concurrently repress TCL1 to initiate its silencing.


Conflict of interest statement

The authors declare no conflict of interest.

Figures

Fig. 1.
Fig. 1.
cAMP increases TCL1 expression in B cells and patient B-CLL samples. (A) Ramos B cells were incubated with 0.1 mM dbcAMP for the times indicated, and whole-cell lysates were immunoblotted with CREB or pCREB-133 Abs. (B) TCL1 mRNA levels in Ramos cells responding to dbcAMP for the indicated times were measured by real-time quantitative RT-PCR (SYBRgreen), with expression normalized to a 36B4 gene control. (C) Immunoblot for TCL1 and β-actin in Ramos cells responding to dbcAMP for the indicated times. Band ratios were determined with densitometry. (D) −424luc reporter activity in three different patient B-CLL samples stimulated with 0.1 mM dbcAMP for 72 h. Data are representative of two independent experiments.
Fig. 2.
Fig. 2.
TORC2-dependent, pCREB-133-independent TCL1 activation. (A) −424luc or −m424luc reporter activity in HEK293T cells 48 h after transfection, with or without cotransfection of the mCREB (Ser-133→Ala-133) expression construct. (B) −424luc reporter activity in HEK293T cells 48 h after transfection, with or without cotransfection of the psportTORC2 (M. Montminy) expression construct. (C) Immunoblot for TORC2 repression in HEK293T cells 48 h after transfection with a TORC2 siRNA expression construct. (D) −424luc reporter activity in HEK293T cells at 48 h with or without cotransfection of a TORC2 siRNA expression construct. (E) −424luc reporter activity in HEK293T cells at 48 h with or without cotransfection of TORC2, CREB, or mCREB expression constructs. (F) −424luc reporter activity in HEK293T cells 48 h after transfection, with or without the indicated concentrations of AICAR added 6 h before assay harvest. For all experiments the data were normalized to a cotransfected Renilla luciferase (pRLCMV luciferase) reporter construct. Data represent the mean ± SD of two independent experiments, each done in triplicate.
Fig. 3.
Fig. 3.
TORC2 inhibition represses TCL1 expression in Nalm-6 pre-B cells. (A) Immunoblot showing relative expression levels of TORC2 in Ramos B cells and Nalm-6 pre-B cells. (B) Real-time quantitative RT-PCR of TORC2 mRNA levels in polyclonal Nalm-6 cells stably expressing TORC2 siRNA. (C) Real-time quantitative RT-PCR of TCL1 mRNA levels in polyclonal Nalm-6 cells stably expressing TORC2 siRNA. Data are representative of two independent experiments and plot the mean ± SD of triplicate measurements.
Fig. 4.
Fig. 4.
BCR or CD40 signaling activates CREB and represses TCL1 expression. Ramos B cells were treated with 10 μg/ml anti-IgM, 1 μg/ml anti-CD40, or 0.1 mM dbcAMP for the times indicated. (A) Immunoblot for CREB or pCREB-133 at 1 h of stimulation. (B) Northern blot for TCL1 and GAPDH with densitometry quantification. (C) Immunoblot for TCL1 and β-actin. (D) Immunoblot for CREB or pCREB-133 at 1 h of stimulation. (E) Real-time quantitative RT-PCR of TCL1 expression at 6 h of stimulation.
Fig. 5.
Fig. 5.
TORC2 responds to BCR signaling by leaving the TCL1 promoter and cytoplasmic translocation. (A) Immunoblot for TORC2 and β-actin in lysates from a mixture of naïve, GC, and memory B cells (lane 1), GC and memory B cells (lane 2), naïve B cells (lane 3), GC B cells (lane 4), and memory B cells (lane 5). (B) Immunoblot for TORC2 showing phosphorylated and nonphosphorylated forms with IgM stimulation of Ramos B cells for the times indicated. (C) Immunofluorescent staining for TORC2 in Ramos cells stimulated with IgM and/or dbcAMP at 3 h. Numbers in parentheses indicate the number of cells showing a similar staining pattern with each condition. (D) ChIP assay with Ramos B cells with or without 10 μg/ml anti-IgM stimulation for 1 h. PCR was performed from immunoprecipitated chromatin fragments by using anti-TORC2 or control anti-Ig Abs and primers from SI Fig. 10. (E) TORC2-specific immunohistochemical stain of GC B cells from human tonsil. Note the presence of an unstained macrophage (denoted by a red arrow) and the exclusive cytoplasmic localization of TORC2.
Fig. 6.
Fig. 6.
BCR- and CD40-induced TCL1 repression and apoptosis are rescued by cAMP. (A) Northern blot for TCL1 and GAPDH at 6 h of incubation with 10 μg/ml anti-IgM and/or 0.1 mM dbcAMP in Ramos B cells. (B) Real-time quantitative RT-PCR for TCL1 at 6 h of incubation with 1 μg/ml anti-CD40 and/or 0.1 mM dbcAMP in Ramos B cells. (C) Immunoblot for TCL1 and β-actin in lysates from Ramos cells incubated at 40 h with 10 μg/ml anti-IgM, 1 μg/ml anti-CD40, and/or 0.1 mM dbcAMP. Densitometry quantification is shown in Lower. (D) Ramos cell survival measured by annexin V and propidium iodide exclusion with 10 μg/ml anti-IgM and/or 0.1 mM dbcAMP for the times indicated. (E) Model of CREB-TORC2 regulatory node and effects on OCA-B (36) and TCL1 (12, 15, 36) expression levels in mature human B cells during the GC reaction. Immunostain panels show absent OCA-B expression in pre-GC mantle zone (MZ) B cells and high expression in GC B cells, whereas TCL1 is highly expressed in mantle zone B cells and strongly repressed in GC B cells. See Discussion for details.

Similar articles

Cited by

References

    1. Kuppers R, Klein U, Hansmann ML, Rajewsky K. N Engl J Med. 1999;341:1520–1529. - PubMed
    1. Manser T. J Immunol. 2004;172:3369–3375. - PubMed
    1. McHeyzer-Williams LJ, Driver DJ, McHeyzer-Williams MG. Curr Opin Hematol. 2001;8:52–59. - PubMed
    1. Kuppers R. Nat Rev Cancer. 2005;5:251–262. - PubMed
    1. Shapiro-Shelef M, Calame K. Nat Rev Immunol. 2005;5:230–242. - PubMed

Publication types

MeSH terms