. 2007 Jul 3;46(26):7793-803.
doi: 10.1021/bi700340n. Epub 2007 Jun 6.

Characterization of the physiological turnover of native and inactivated cytochromes P450 3A in cultured rat hepatocytes: a role for the cytosolic AAA ATPase p97?

Affiliations

Characterization of the physiological turnover of native and inactivated cytochromes P450 3A in cultured rat hepatocytes: a role for the cytosolic AAA ATPase p97?

Saadia Faouzi et al. Biochemistry. .

Abstract

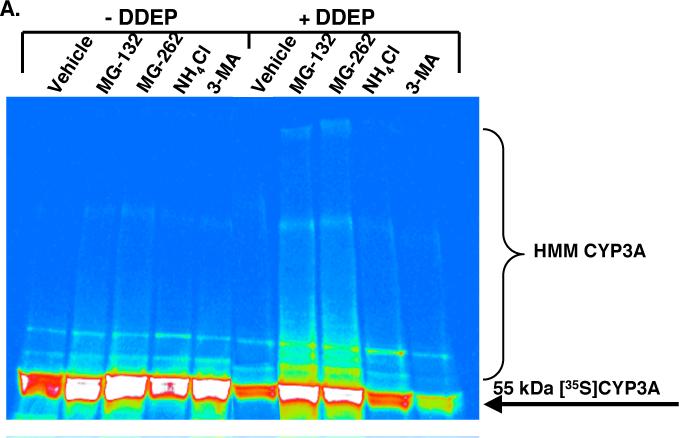
Mammalian hepatic cytochromes P450 (P450s) are endoplasmic reticulum (ER)-anchored hemoproteins engaged in the metabolism of numerous xeno- and endobiotics. P450s exhibit widely ranging half-lives, utilizing both autophagic-lysosomal (ALD) and ubiquitin-dependent 26S proteasomal (UPD) degradation pathways. Although suicidally inactivated hepatic CYPs 3A and "native" CYP3A4 in Saccharomyces cerevisiae are degraded via UPD, the turnover of native hepatic CYPs 3A in their physiological milieu has not been elucidated. Herein, we characterize the degradation of native, dexamethasone-inducible CYPs 3A in cultured primary rat hepatocytes, using proteasomal (MG-132 and MG-262) and ALD [NH4Cl and 3-methyladenine (3-MA)] inhibitors to examine their specific degradation route. Pulse-chase with immunoprecipitation analyses revealed a basal 52% 35S-CYP3A loss over 6 h, which was stabilized by both proteasomal inhibitors. By contrast, no corresponding CYP3A stabilization was detected with either ALD inhibitor NH4Cl or 3-MA. Furthermore, MG-262-induced CYP3A stabilization was associated with its polyubiquitylation, thereby verifying that native CYPs 3A were also degraded via UPD. To identify the specific participants in this process, cellular proteins were cross-linked in situ with paraformaldehyde (PFA) in cultured hepatocytes. Immunoblotting analyses of CYP3A immunoprecipitates after PFA-cross-linking revealed the presence of p97, a cytosolic AAA ATPase instrumental in the extraction and delivery of ubiquitylated ER proteins for proteasomal degradation. Such native CYP3A-p97 interactions were greatly magnified after CYP3A suicidal inactivation (which accelerates UPD), and/or proteasomal inhibition, and were confirmed by proteomic and confocal immunofluorescence microscopic analyses. These findings clearly reveal that native CYPs 3A undergo UPD and implicate a role for p97 in this process.


Figures

Fig. 1
Fig. 1. Turnover of native CYP3A in cultured rat hepatocytes over 6 h
Hepatocytes were cultured, Dex-pretreated and pulse-labeled with 35S-Met/Cys as described (Methods). One h after pulse labeling, MG-132 (20 μM), MG-262 (10 μM), 3-MA (5 mM) and/or NH4Cl (20 mM) were added. Cells were harvested at indicated times thereafter, lysates were prepared and subjected to CYP3A IP analyses. A. Pulse-chase analyses of native CYP3A immunoprecipitates subjected to SDS-PAGE on 4−20% polyacrylamide gels followed by PhosphorImager and ImageQuant analyses. Values are mean ± SD obtained from 4−8 individual experiments. At 6 h, statistically significant differences at p<0.001 (**) and p<0.05 (*) were found between MG-262- and MG-132-treated values and corresponding vehicle-controls, respectively. B. Relative CYP3A losses (Mean ± SD) monitored by 35S-radioctivity in CYP3A immunoprecipitates at 6 h relative to 0 h-control in 5 individual experiments. Statistically significant differences at p<0.01 (**) and p<0.05 (*) were found between MG-262- and MG-132-treated values and corresponding vehicle-controls, respectively. C. Effects of proteasomal and ALD inhibitors on native CYP3A ubiquitylation (HMM), as monitored by SDS-PAGE and relative 35S-fluorography of CYP3A immunoprecipitates by PhosphorImager analyses from cells harvested at 0, 1 and 6 h post-chase. The relative intensity of the 35S-labeling according to the color wheel intensity code is: white>red>orange>yellow>green>blue. D. Corresponding native CYP3A ubiquitylation profiles as determined by Western IB analyses of CYP3A immunoprecipitates with anti-Ub IgGs as described (Methods).
Fig. 2
Fig. 2. Assessment of relative cytotoxicity profiles of cultured hepatocytes after treatment with DDEP and/or ALD or proteasomal inhibitors
Cells were treated with DDEP in the presence or absence of ALD or proteasomal inhibitors as described (Methods). At 6 h after DDEP treatment, media from the variously treated cell cultures were collected and assayed for AK activity by the ToxiLight protocol. Values were expressed as relative luminescence units (RLUs; mean ± SD; n = 3), and compared with a positive control consisting of AK released by damage inflicted by repeated cycles of freeze thawing. Asterisks indicate statistically significant differences at p< 0.001 from freeze-thawed AK-values (positive control). None of the treatments resulted in any statistically significant leakage of AK into the culture medium relative to the vehicle control.
Fig. 3
Fig. 3. Effects of TAO-treatment and/or ALD or proteasomal inhibitors on CYP3A stability in cultured hepatocytes
Cells were treated with TAO in the presence or absence of ALD or proteasomal inhibitors as described (Methods). A. Microsomes were prepared from cells harvested at the indicated times and subjected to IB analyses with anti-CYP3A IgGs. B. Corresponding densitometric quantitation of immunoblots from microsomes pooled from two separate cell cultures in two separate experiments. MG-262 and 3MA/NH4Cl were present during the last 6 h of 30 h TAO-treatment. C. Corresponding CYP3A ubiquitylation profiles obtained by Western IB analyses of CYP3A immunoprecipitates with anti-Ub IgGs as described (Methods).
Fig. 4
Fig. 4. Effects of proteasomal and ALD inhibitors on native (-DDEP) and DDEP-inactivated CYP3A turnover
Cells were 35S-pulse-labeled as described (Methods). At 0 post-chase, cells were treated with DDEP (100 μM) or equivalent volume of vehicle (DMSO) in the presence or absence of proteasomal or ALD inhibitors and harvested 6 h later. A. Effects of UPD and ALD inhibitors on native and DDEP-inactivated CYP3A loss (detected at 55 kDa) and ubiquitylation (HMM), as monitored by SDS-PAGE and relative 35S-fluorography of CYP3A immunoprecipitates by PhosphorImager analyses. The relative intensity of the 35S-labeling according to the color wheel intensity code is: white>red>orange>yellow>green>blue. B. Corresponding native or DDEP-inactivated CYP3A ubiquitylation profiles as determined by Western IB analyses of CYP3A immunoprecipitates with anti-Ub IgGs as described (Methods).
Fig. 5
Fig. 5. p97-CYP3A interaction during CYP3A ERAD through PFA crosslinking/proteomic and CIFM analyses
A. p97 IB analyses of in situ PFA-crosslinked CYP3A immunoprecipitates: Cultured rat hepatocytes were treated with or without DDEP and/or MG-262 for 0−1 h, and in vivo crosslinked with 2.5% PFA for 15 min at 37°C. After termination, cells were harvested and CYP3A immunoprecipitates were subjected to p97 IB analyses before (a) or after reversal of crosslinking by boiling at 95°C for 10 min (b). In parallel, CYP3A coimmunoprecipitates were also subjected to SDS-PAGE, sequential slicing of the gels and in situ tryptic digestion of gel bands followed by LC-MS/MS analyses of tryptic peptides by reversed-phase HPLC (Methods). The copresence of ubiquitylated CYP3A23 and p97 in these CYP3A immunoprecipitates was confirmed by LC-MS/MS analyses of the in situ tryptic digests of gel bands from both a and b. As indicated by the asterisks, in (a) ubiquitylated CYP3A comigrated as the crosslinked p97 complex to the top of the gel (the presence of Ub was confirmed from 7 different CID spectra with a 71% sequence coverage; p97 was identified from its acetylated N-terminal peptide, but 2 CID spectra acquired from the 2+ as well as the 3+ molecular ions; and CYP3A1 was identified from 3 unique peptides – Supplementary Figures 1-3 illustrate the data quality). After PFA-crosslinking reversal (b) ubiquitylated CYP3A and p97 electrophoretically migrated according to their relative masses. No corresponding ions were found in tryptic digests of the mock immunoprecipitation controls, run in parallel. The electrophoretic migration profiles of CYP3A and ubiquitin were consistent with that of 35S-CYP3A HMM (Fig. 4A) and ubiquitylated CYP3A (Fig. 4B). B. p97-Colocalization with CYP3A by CIFM analysis in untreated, DDEP- and DDEP/MG-262-treated rat hepatocytes: After crosslinking, treated and untreated rat hepatocyte cultures were fixed and simultaneously stained with antibodies to CYP3A (green) and p97 (red).
Fig. 6
Fig. 6. ERAD/UPD of DDEP-inactivated CYPs 3A
A plausible role for p97 in the dislocation of ubiquitylated CYP3A and delivery to the 26S proteasome.
Fig. 6
Fig. 6. ERAD/UPD of DDEP-inactivated CYPs 3A
A plausible role for p97 in the dislocation of ubiquitylated CYP3A and delivery to the 26S proteasome.

References

    1. Correia MA. Hepatic cytochrome P450 degradation: mechanistic diversity of the cellular sanitation brigade. Drug Metab Rev. 2003;35:107–143. and references therein. - PubMed
    1. Klionsky DJ. The molecular machinery of autophagy: unanswered questions. J Cell Sci. 2005;118:7–18. - PMC - PubMed
    1. Ohsumi Y. Molecular dissection of autophagy in the yeast Saccharomyces cerevisiae. In: Mayer RJ, Ciechanover A, Rechsteiner M, editors. Protein degradation. Vol. 2. The Ubiquitin-Proteasome system; 2006. 2006. pp. 31–50.
    1. Romisch K. Endoplasmic reticulum-associated degradation. Annu Rev Cell Dev Biol. 2005;21:435–456. - PubMed
    1. Schafer A, Wolf DH. Endoplasmic reticulum-associated protein quality control and degradation: genome-wide screen for ERAD components. Methods Mol Biol. 2005;301:289–292. - PubMed

Publication types

MeSH terms

Substances

LinkOut - more resources