. 2007;8(6):R103.
doi: 10.1186/gb-2007-8-6-r103.

Characterization and modeling of the Haemophilus influenzae core and supragenomes based on the complete genomic sequences of Rd and 12 clinical nontypeable strains

Affiliations

Characterization and modeling of the Haemophilus influenzae core and supragenomes based on the complete genomic sequences of Rd and 12 clinical nontypeable strains

Justin S Hogg et al. Genome Biol. 2007.

Abstract

Background: The distributed genome hypothesis (DGH) posits that chronic bacterial pathogens utilize polyclonal infection and reassortment of genic characters to ensure persistence in the face of adaptive host defenses. Studies based on random sequencing of multiple strain libraries suggested that free-living bacterial species possess a supragenome that is much larger than the genome of any single bacterium.

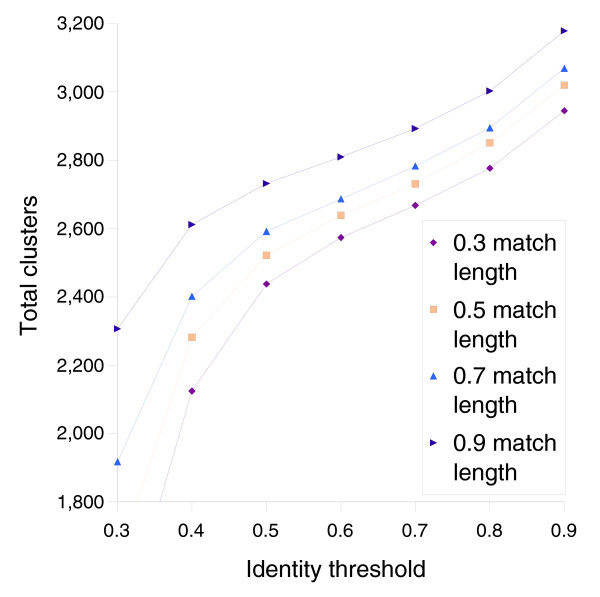
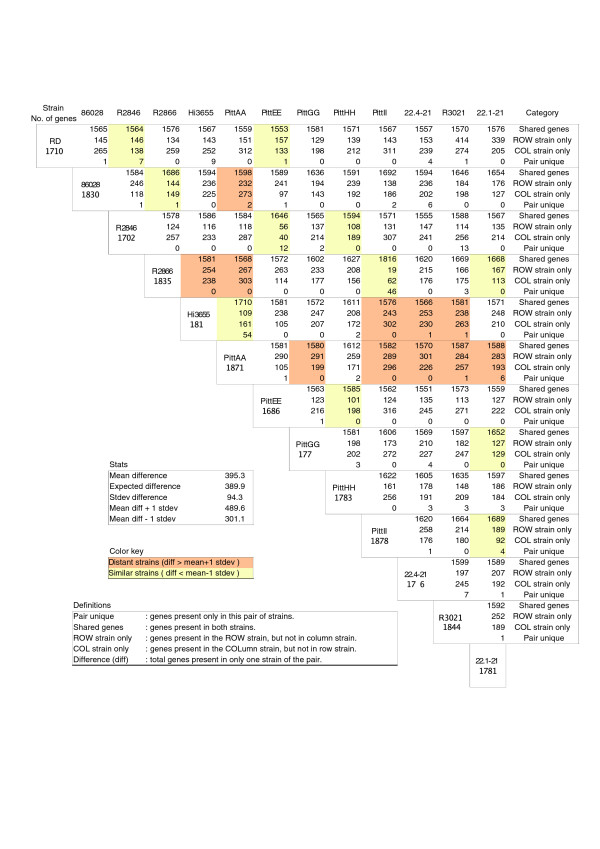
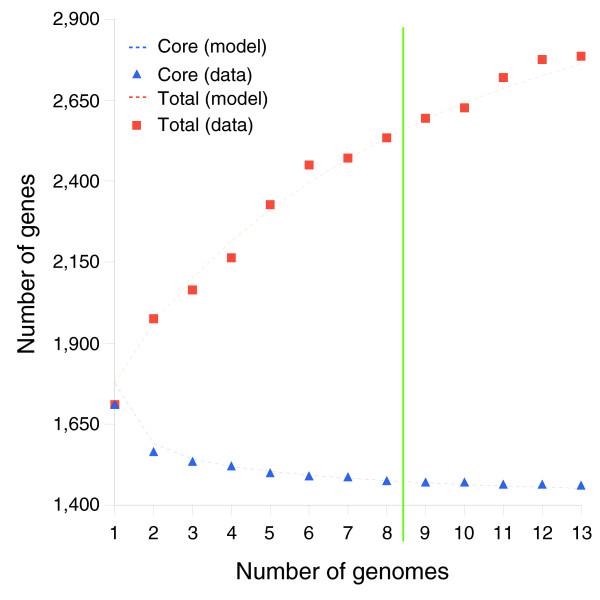
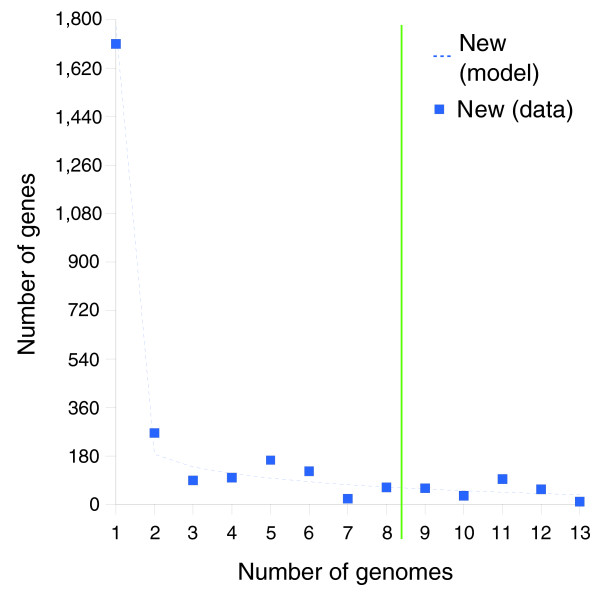
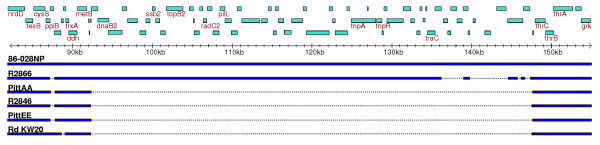
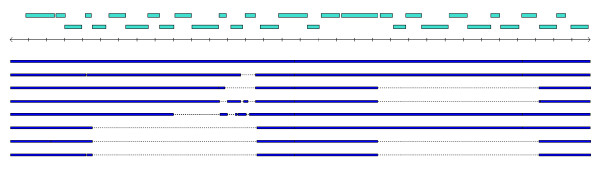
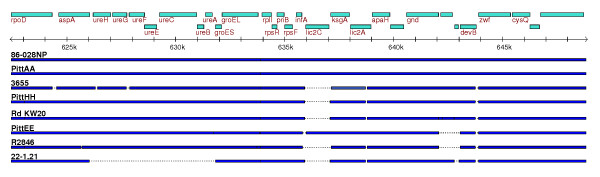
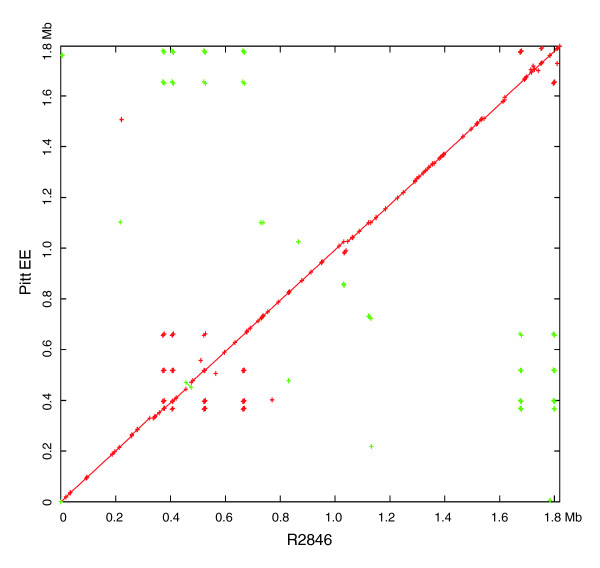
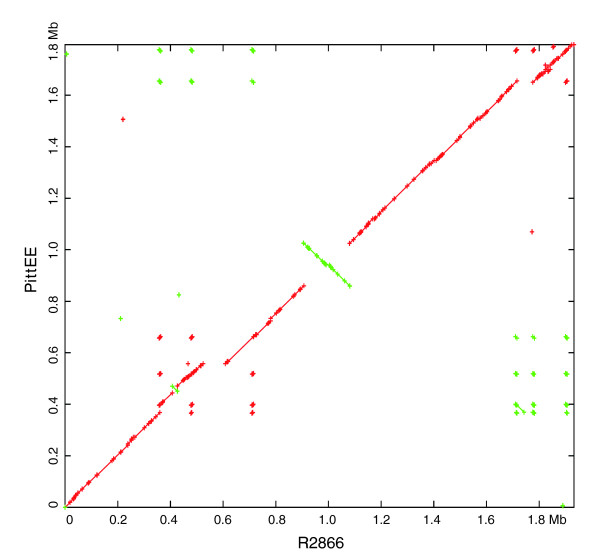
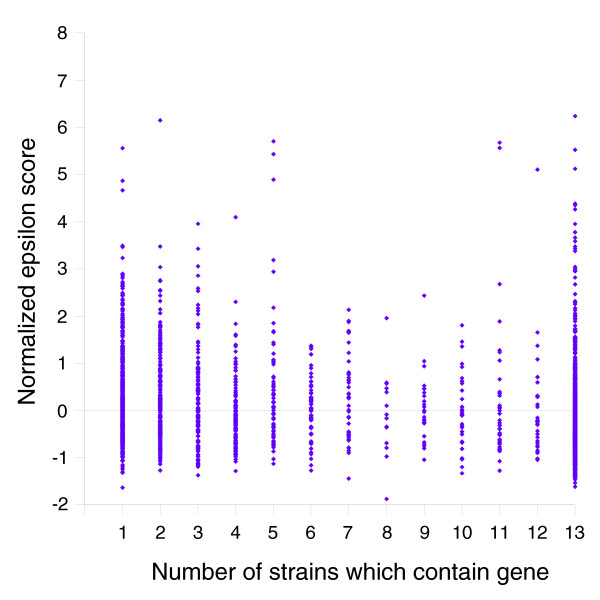
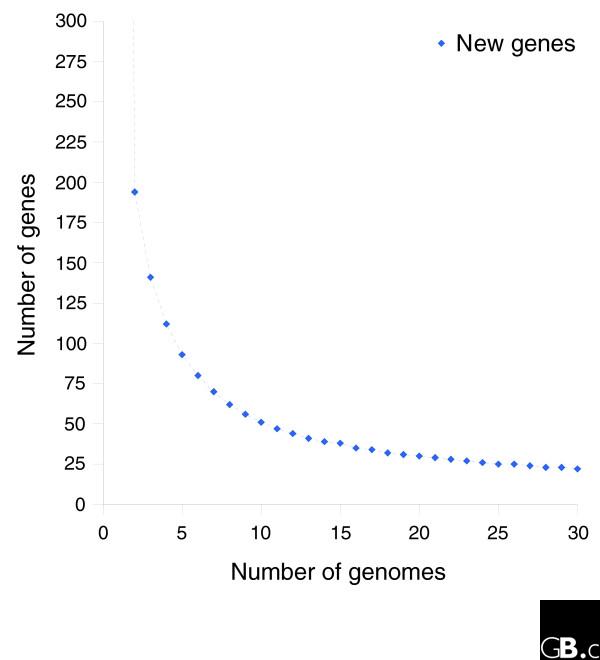
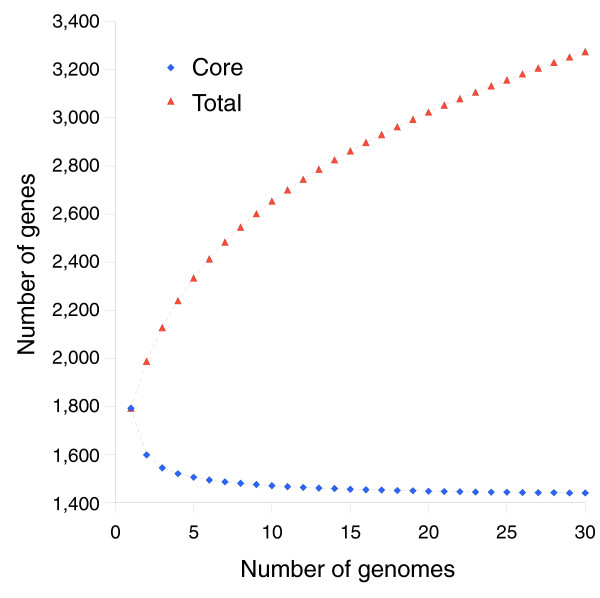
Results: We derived high depth genomic coverage of nine nontypeable Haemophilus influenzae (NTHi) clinical isolates, bringing to 13 the number of sequenced NTHi genomes. Clustering identified 2,786 genes, of which 1,461 were common to all strains, with each of the remaining 1,328 found in a subset of strains; the number of clusters ranged from 1,686 to 1,878 per strain. Genic differences of between 96 and 585 were identified per strain pair. Comparisons of each of the NTHi strains with the Rd strain revealed between 107 and 158 insertions and 100 and 213 deletions per genome. The mean insertion and deletion sizes were 1,356 and 1,020 base-pairs, respectively, with mean maximum insertions and deletions of 26,977 and 37,299 base-pairs. This relatively large number of small rearrangements among strains is in keeping with what is known about the transformation mechanisms in this naturally competent pathogen.

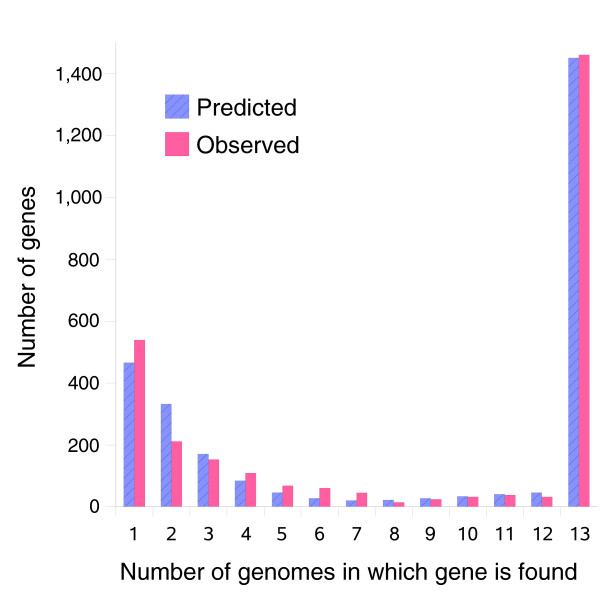
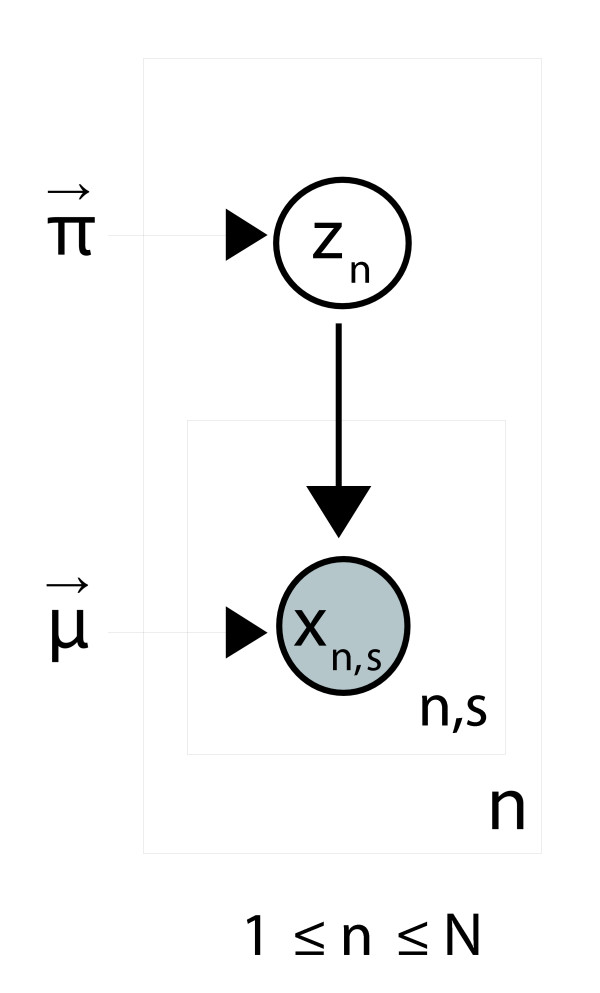
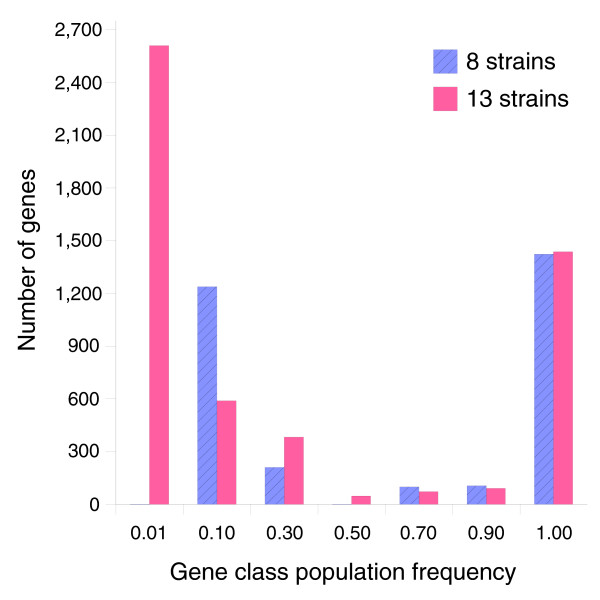
Conclusion: A finite supragenome model was developed to explain the distribution of genes among strains. The model predicts that the NTHi supragenome contains between 4,425 and 6,052 genes with most uncertainty regarding the number of rare genes, those that have a frequency of <0.1 among strains; collectively, these results support the DGH.


Figures

Figure 1
Figure 1
A plot of the total number of clusters as a function of clustering parameters shows an inflection point near 0.65 identity and 0.70 match length. The inflection, which minimizes the rate of change in the number of clusters per change in parameters, suggests a set of parameters that optimally segregates orthologs and paralogs.
Figure 2
Figure 2
A histogram of gene clusters observed in exactly N of 13 H. influenzae strains compared to the expected number of genes estimated by the supragenome model (trained on all 13 strains). Over 1,400 genes were observed in all 13 strains, indicating that there is a common core set of genes. Distributed genes appear in variable numbers of strains, from 1 to 12. Overall, the model fits the data well, though it underestimated the number of genes observed once and overestimated the number of genes observed twice.
Figure 3
Figure 3
A pairwise genic comparison of 12 NTHi strains of H. influenzae and the reference strain Rd KW20. The comparison of two strains is found at the intersection of the row and column corresponding to the respective strains. Strains are compared based on the number of genes shared between the pair, the number of genes found in one strain but not the other, and the number of shared genes that are unique to that pair of strains. A typical pair of strains differs by 395 genes. Similar pairs of strains are shaded in yellow, while divergent strains are shaded orange.
Figure 4
Figure 4
Plotting of relationships among the sequenced NTHi strains by gene sharing and multi-locus sequence typing. (a) A dendrogram based on genic differences among the 13 strains of H. influenzae. While several pairs of strains appear to be closely related, there is not a well-defined clade structure. The dendrogram was generated using the unweighted pair group method with arithmetic mean (UPGMA) method [44-46]. The number on each branch corresponds to the number of genic differences from the previous branch point. (b) A dendrogram based on sequence alignments of the seven MLST loci. The tree was built using the maximum likelihood method implemented in fastDNAml. The number on each branch corresponds to the number of point mutations per kilobase from the previous branch point. The topologies of the genic and MLST based trees are different. Most notably, strains PittEE and R2846 are closely related in the genic dendrogram, but are separated in the MLST dendrogram. In other instances, such as PittII and R2866, the strains are closely related in both trees.
Figure 5
Figure 5
The expected number of total gene clusters and core gene clusters identified at the addition of each genome to the clustering dataset. Modeling predictions are based on the eight strain training set (see 'Mathematical development of a finite supragenome model'). The number of genes observed in all strains levels off to an asymptote that corresponds to a core set of genes. The rate of increase in total genes decreases, but does not level off due to the discovery of rare genes.
Figure 6
Figure 6
The observed and expected number of new gene clusters found at the addition of each genome to the clustering dataset. Modeling predictions are based on the eight strain training set (see 'Mathematical development of a finite supragenome model').
Figure 7
Figure 7
A multi-sequence alignment using 86-028NP as a reference shows varying degrees of homology among 6 strains to a 50 kb region homologous to the plasmid ICEhin1056. The plasmid is integrated in 86-028NP and is partially present in R2866, but absent from the other strains in the alignment. Sequences present in other strains without homology to 86-028NP are not shown.
Figure 8
Figure 8
A 40 kb region present in Rd KW20 shows two blocks of genomic variation among other strains. The upstream block is bounded on the right by a frame-shifted insertion sequence (IS) element (HI1018). The downstream block (HI1024-HI1032) includes genes with likely roles in sugar transport and metabolism. Rd is used as a reference for the alignment, and sequence present in other strains without homology to Rd is not shown.
Figure 9
Figure 9
A 20 kb region that demonstrates strain diversity at the level of an individual gene (lic2C), a pair of genes (NTHi0683/4), and a group of seven functionally related genes (urease system). 86-028NP is used as a reference for the alignment, and sequence present in other strains without homology to 86-028NP is not shown.
Figure 10
Figure 10
A global alignment of R2846 and PittEE as visualized by Mummerplot. A point is placed at the (x,y) coordinate if the x-coordinate of R2846 matches the y-coordinate of PittEE. Green matches indicate a reverse complement match. It can be seen that PittEE and R2846 are similar at the global level.
Figure 11
Figure 11
Global alignment of R2866 and PittEE shows a large inversion and several regions unique to each strain. The strains are similar across the majority of the genome; however, there is one large inversion as well as several regions unique to each strain.
Figure 12
Figure 12
Codon usage of genes is quantified by a normalized epsilon score [26]. Low epsilon scores indicate that a gene's codon usage is similar to the typical H. influenzae codon usage pattern. The range of epsilon scores is similar for all three classes of genes: unique, distributed and core. However, the median scores are significantly different among the classes. The observation that the distributions for non-core genes overlap with the core genes suggests that many of the non-core genes have been evolving in the same pool with the core genes.
Figure 13
Figure 13
A plate diagram of the H. influenzae supragenome model. Each node in the diagram represents a random variable, and the arrows indicate dependence between the variables. Independent, identically distributed (IID) nodes appear in boxes with an index listed in the corner.
Figure 14
Figure 14
The distribution of genes among gene classes in the supragenome model trained on 8 or 13 strains. The only significant difference occurs in the rare gene categories with frequency 0.01 and 0.10. A small sample of eight strains is not expected to generate accurate predictions for these categories.
Figure 15
Figure 15
A theoretical plot of the number of new genes expected to be found in the Nth genome for future H. influenzae sequencing projects. The plot was generated using strains isolated in North America, and the extrapolation may not hold for isolates from other geographic locales if some distributed genes are geographically isolated. The model predicts that the number of new genes found in a strain will diminish 20 after sequencing 30 strains, and the number will trend toward 0 as the number of sequences becomes large.
Figure 16
Figure 16
A theoretical plot of the number of total genes and core genes expected among N sequenced H. influenzae genomes for future sequencing projects. The extrapolation may not hold for strains isolated outside of North America since the plot was constructed using only North American isolates. The number of core genes approaches an asymptote, which reflects a common set of genes present in all natural isolates.

Similar articles

Cited by

References

    1. Ehrlich GD, Veeh R, Wang X, Costerton JW, Hayes JD, Hu FZ, Daigle BJ, Ehrlich MD. Mucosal biofilm formation on middle-ear mucosa in the chinchilla model of otitis media. JAMA. 2002;287:1710–1715. - PubMed
    1. Hall-Stoodley L, Hu FZ, Giesecke A, Nistico L, Nguyen D, Hayes J, Forbes M, Greenberg DP, Dice B, Burrows A, et al. Direct detection of bacterial biofilms on the middle-ear mucosa of children with chronic otitis media. JAMA. 2006;296:202–211. - PMC - PubMed
    1. Post JC, Preston RA, Aul JJ, Larkins-Pettigrew M, Rydquist-White J, Anderson KW, Wadowsky RM, Reagan DR, Walker ES, Kingsley LA, et al. Molecular analysis of bacterial pathogens in otitis media with effusion. JAMA. 1995;273:1598–1604. - PubMed
    1. Murphy TF, Sethi S, Klingman KL, Brueggemann AB, Doern GV. Simultaneous respiratory tract colonization by multiple strains of nontypeable Haemophilus influenzae in chronic obstructive pulmonary disease: implications for antibiotic therapy. J Infect Dis. 1999;180:404–409. - PubMed
    1. Starner TD, Zhang N, Kim G, Apicella MA, McCray PB., Jr Haemophilus influenzae forms biofilms on airway epithelia: implications in cystic fibrosis. Am J Respir Crit Care Med. 2006;174:213–220. - PMC - PubMed

Publication types