. 2007 Jun 5:6:21.
doi: 10.1186/1475-925X-6-21.

Myocardial segment-specific model generation for simulating the electrical action of the heart

Affiliations

Myocardial segment-specific model generation for simulating the electrical action of the heart

Darren A Hooks. Biomed Eng Online. .

Abstract

Background: Computer models of the electrical and mechanical actions of the heart, solved on geometrically realistic domains, are becoming an increasingly useful scientific tool. Construction of these models requires detailed measurement of the microstructural features which impact on the function of the heart. Currently a few generic cardiac models are in use for a wide range of simulation problems, and contributions to publicly accessible databases of cardiac structures, on which models can be solved, remain rare. This paper presents to-date the largest database of porcine left ventricular segment microstructural architecture, for use in both electrical and mechanical simulation.

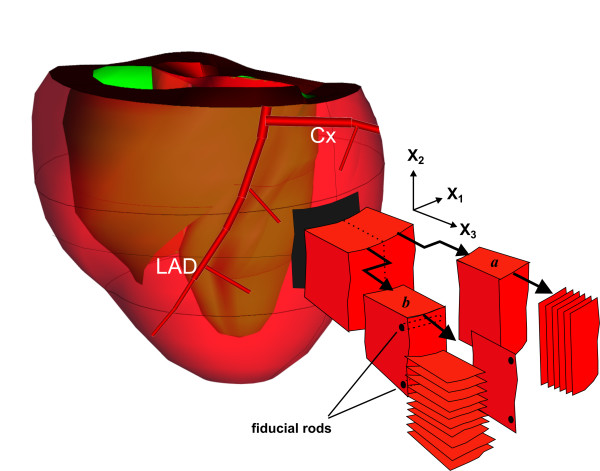
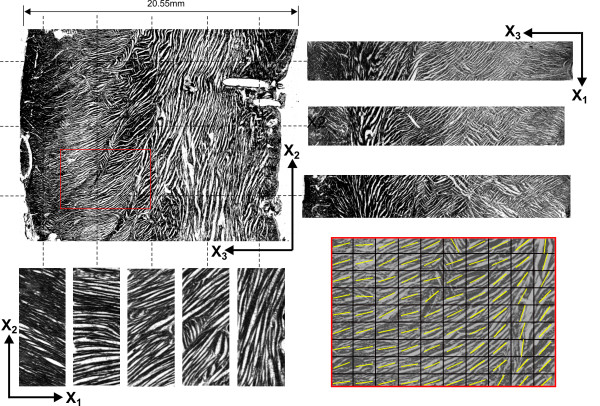
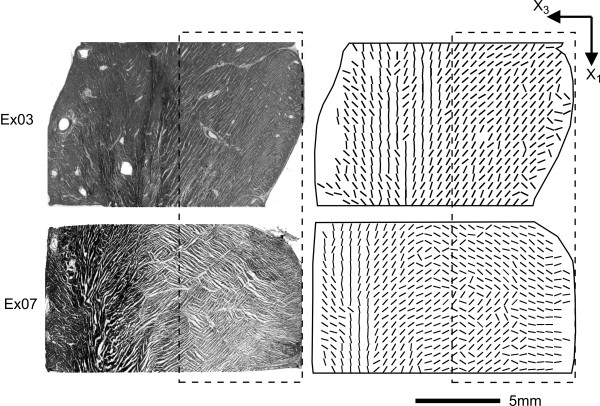
Methods: Cryosectioning techniques were used to reconstruct the myofibre and myosheet orientations in tissue blocks of size ~15 x 15 x 15 mm, taken from the mid-anterior left ventricular freewall, of seven hearts. Tissue sections were gathered on orthogonal planes, and the angles of intersection of myofibres and myosheets with these planes determined automatically with a gradient intensity based algorithm. These angles were then combined to provide a description of myofibre and myosheet variation throughout the tissue, in a form able to be input to biophysically based computational models of the heart.

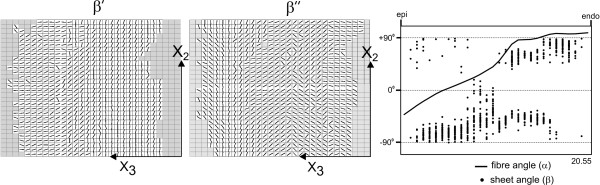
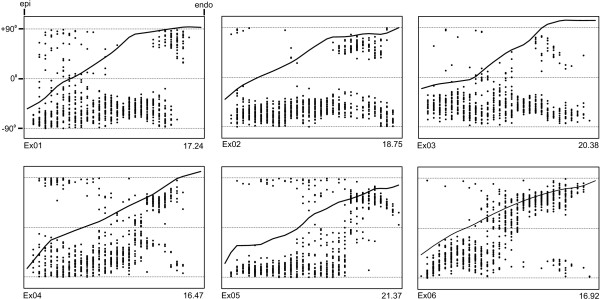
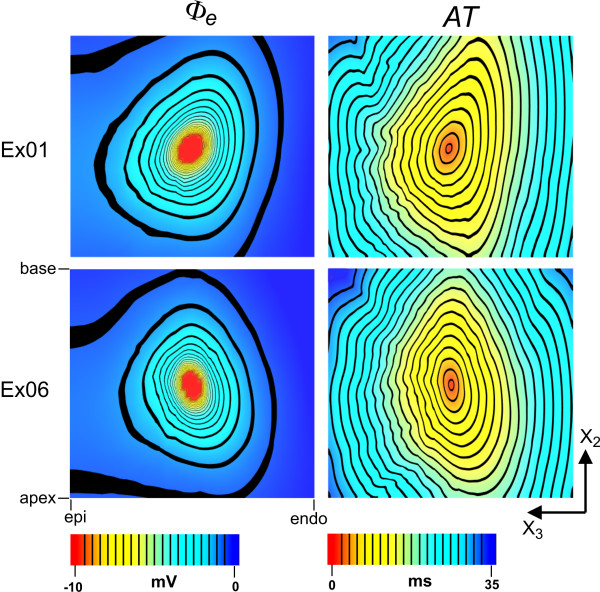
Results: Several microstructural features were common across all hearts. Myofibres rotated through 141 +/- 18 degrees (mean +/- SD) from epicardium to endocardium, in near linear fashion. In the outer two-thirds of the wall sheet angles were predominantly negative, however, in the inner one-third an abrupt change in sheet angle, with reversal in sign, was seen in six of the seven hearts. Two distinct populations of sheets with orthogonal orientations often co-existed, usually with one population dominating. The utility of the tissue structures was demonstrated by simulating the passive and active electrical responses of two of the tissue blocks to current injection. Distinct patterns of electrical response were obtained in the two tissue blocks, illustrating the importance of testing model based predictions on a variety of tissue architectures.

Conclusion: This study significantly expands the set of geometries on which models of cardiac function can be solved.


Figures

Figure 1
Figure 1
Schematic of the tissue sectioning regime in relation to cardiac coordinates X1, X2, X3. A block of anterior LV freewall myocardium is cut from the heart, and divided into two smaller blocks a and b. The block originates from the region of watershed between the left anterior descending (LAD) and circumflex (Cx) artery supply territories. Sections are taken from block a in the epicardial (X1-X2) plane, and from block b in both the base-apex (X2-X3) and circumferential (X1-X3) planes. Registration of sections from block b is aided by placement of fiducial rods prior to sectioning.
Figure 2
Figure 2
Sample of tissue sections from tissue block EX07. Upper left: Base-apex plane (X2-X3) section showing the orientation of myolaminae throughout the ventricular wall. Upper right: Circumferential plane (X1-X3) sections taken at three X2 locations through the wall. Lower left: Epicardial (X1-X2) plane sections taken at five X3 locations, revealing the gradual change in myofibre orientation from epicardium to endocardium. Lower right: Inset from the upper-left base-apex section showing zoomed-in section of tissue with overlayed structural angles automatically determined by the gradient-intensity algorithm.
Figure 3
Figure 3
Model description of tissue block EX07. Left panel: Cleavage plane angles (β') computed for the base-apex section shown in Fig. 2 upper-left, on a 30 × 30 grid. Middle panel: Cleavage plane angles (β") computed from serial circumferential plane (X1-X3) sections, mapped to the same base-apex plane as in A. Each row of angles is derived from a single circumferential plane tissue section, along its edge that abuts the base-apex plane section. Grayed boxes in the grids of both β' and β" panels represent areas of indeterminate cleavage plane angle. Right panel: Graph of the full model description including the transmural dependence of myofibre angle (line), from epicardium (epi) to endocardium (endo), and transmural distribution of sheet angles (β; dots) as derived from the β' and β" fields. The transmural thickness of the tissue block (20.55 mm) is shown at the bottom-right corner of the graph.
Figure 4
Figure 4
Model geometries from heart blocks Ex01-Ex06. Each graph shows the transition in fibre angle through the heart wall, from epicardium (left) to endocardium (right), plotted between -90° to +90° (upper and lower horizontal dashed lines respectively). The transmural depth of each tissue block is recorded in mm at the bottom right of each graph.
Figure 5
Figure 5
Example simulations. Examples of simulations using model volumes Ex01 (upper panels) and Ex06 (lower panels). Extracellular potential fields (Φe) generated by focal current application at the tissue centres are shown in the left panels. Activation time (AT) fields derived from wavefront propagation from the site of current injection are shown in the right panels. The epi (epicardium) to endo (endocardium) distance is ~17 mm for both models.
Figure 6
Figure 6
Structural variation in the circumferential direction. Circumferential (X1-X3) plane sections shown from two hearts to demonstrate the dependence of sheet angle on X1 location. Dashed box encompasses the approximate region where fibre angle is >45° – where sheet orientations can be determined from X1-X3 plane sections with good accuracy. The right panels contain the automatically determined structural angles. Tissue block Ex03 demonstrates constant sheet orientations over 10 mm in the X1 direction, whilst the predominant sheet angle in Ex07 reverses through 90° over the same distance.

References

    1. Hunter PJ, Smaill BH, Nielsen PMF, LeGrice IJ. A mathematical model of cardiac anatomy Computational Biology of the Heart. New York: John Wiley & Sons Ltd; 1997.
    1. Nielsen P, LeGrice IJ, Smaill BH, Hunter PJ. Mathematical Model of Geometry and Fibrous Structure of the Heart. Am J Physiol. 1991;260:H1365–78. - PubMed
    1. Hooks DA, Tomlinson KA, Marsden S, LeGrice IJ, Smaill BH, Hunter PJ. Cardiac microstructure: implications for electrical propagation and defibrillation in the heart. Circulation Research. 2002;91:331–338. doi: 10.1161/01.RES.0000031957.70034.89. - DOI - PubMed
    1. Helm P, Beg MF, Miller MI, Winslow RL. Measuring and mapping cardiac fiber and laminar architecture using diffusion tensor MR imaging. Annals of the New York Academy of Sciences. 2005;1047:296–307. doi: 10.1196/annals.1341.026. - DOI - PubMed
    1. Vetter FJ, McCulloch AD. Three-dimensional analysis of regional cardiac function: a model of rabbit ventricular anatomy. Progress in Biophysics and Molecular Biology. 1998;69:157–184. doi: 10.1016/S0079-6107(98)00006-6. - DOI - PubMed

Publication types

LinkOut - more resources