

Transient 2D IR spectroscopy of ubiquitin unfolding dynamics
- PMID: 17551015
- PMCID: PMC1964855
- DOI: 10.1073/pnas.0700959104
Transient 2D IR spectroscopy of ubiquitin unfolding dynamics
Abstract
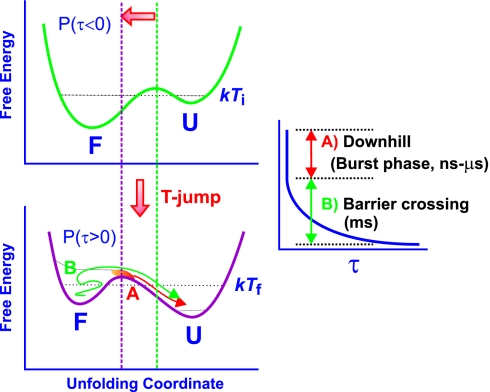
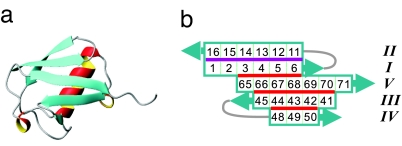
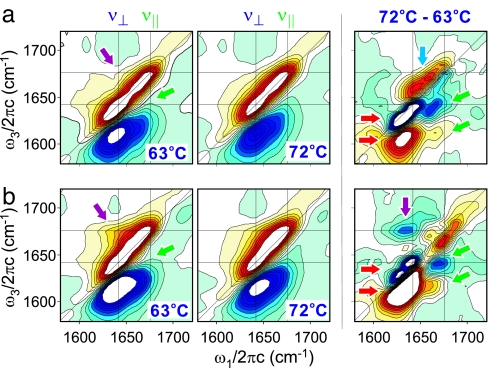
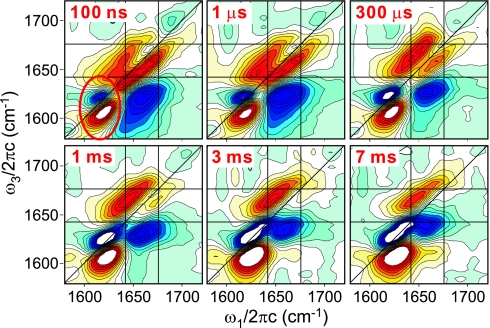
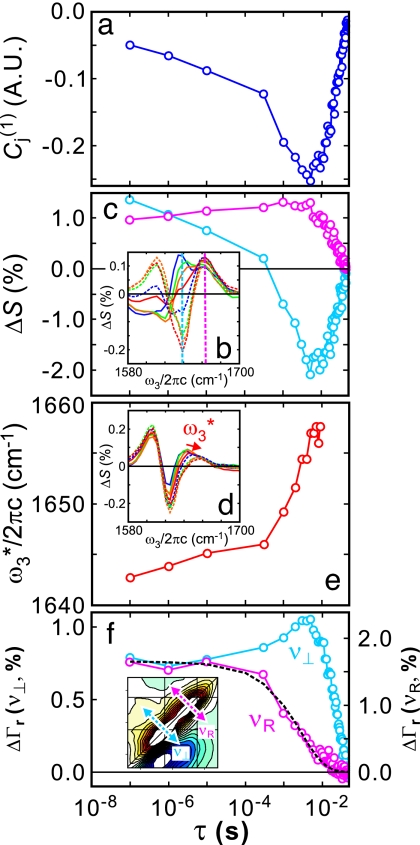
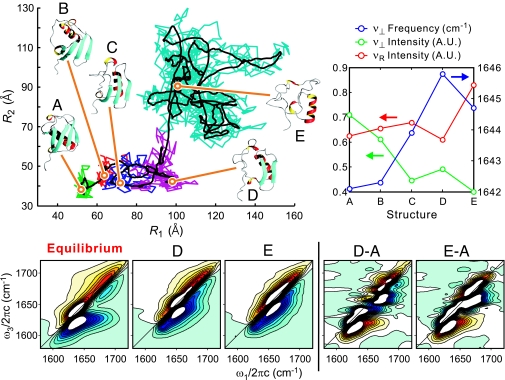
Transient two-dimensional infrared (2D IR) spectroscopy is used as a probe of protein unfolding dynamics in a direct comparison of fast unfolding experiments with molecular dynamics simulations. In the experiments, the unfolding of ubiquitin is initiated by a laser temperature jump, and protein structural evolution from nanoseconds to milliseconds is probed using amide I 2D IR spectroscopy. The temperature jump prepares a subensemble near the unfolding transition state, leading to quasi-barrierless unfolding (the "burst phase") before the millisecond activated unfolding kinetics. The burst phase unfolding of ubiquitin is characterized by a loss of the coupling between vibrations of the beta-sheet, a process that manifests itself in the 2D IR spectrum as a frequency blue-shift and intensity decrease of the diagonal and cross-peaks of the sheet's two IR active modes. As the sheet unfolds, increased fluctuations and solvent exposure of the beta-sheet amide groups are also characterized by increases in homogeneous linewidth. Experimental spectra are compared with 2D IR spectra calculated from the time-evolving structures in a molecular dynamics simulation of ubiquitin unfolding. Unfolding is described as a sequential unfolding of strands in ubiquitin's beta-sheet, using two collective coordinates of the sheet: (i) the native interstrand contacts between adjacent beta-strands I and II and (ii) the remaining beta-strand contacts within the sheet. The methods used illustrate the general principles by which 2D IR spectroscopy can be used for detailed dynamical comparisons of experiment and simulation.
Conflict of interest statement
The authors declare no conflict of interest.
Figures
Similar articles
-
Conformational changes during the nanosecond-to-millisecond unfolding of ubiquitin.Proc Natl Acad Sci U S A. 2005 Jan 18;102(3):612-7. doi: 10.1073/pnas.0408646102. Epub 2005 Jan 3. Proc Natl Acad Sci U S A. 2005. PMID: 15630083 Free PMC article.
-
Amide I two-dimensional infrared spectroscopy of proteins.Acc Chem Res. 2008 Mar;41(3):432-41. doi: 10.1021/ar700188n. Epub 2008 Feb 21. Acc Chem Res. 2008. PMID: 18288813 Review.
-
Temperature-dependent downhill unfolding of ubiquitin. II. Modeling the free energy surface.Proteins. 2008 Jul;72(1):488-97. doi: 10.1002/prot.22042. Proteins. 2008. PMID: 18384149
-
Probing the folding transition state of ubiquitin mutants by temperature-jump-induced downhill unfolding.Biochemistry. 2008 Dec 30;47(52):13870-7. doi: 10.1021/bi801603e. Biochemistry. 2008. PMID: 19053229 Free PMC article.
-
Interface-specific ultrafast two-dimensional vibrational spectroscopy.Acc Chem Res. 2009 Sep 15;42(9):1332-42. doi: 10.1021/ar900016c. Acc Chem Res. 2009. PMID: 19441810 Review.
Cited by
-
A molecular interpretation of 2D IR protein folding experiments with Markov state models.Biophys J. 2014 Mar 18;106(6):1359-70. doi: 10.1016/j.bpj.2014.02.008. Biophys J. 2014. PMID: 24655511 Free PMC article.
-
Unraveling dynamic protein structures by two-dimensional infrared spectra with a pretrained machine learning model.Proc Natl Acad Sci U S A. 2024 Jul 2;121(27):e2409257121. doi: 10.1073/pnas.2409257121. Epub 2024 Jun 25. Proc Natl Acad Sci U S A. 2024. PMID: 38917009 Free PMC article.
-
Applications of two-dimensional infrared spectroscopy.Analyst. 2015 Jul 7;140(13):4336-49. doi: 10.1039/c5an00558b. Analyst. 2015. PMID: 26007625 Free PMC article. Review.
-
Direct observation of peptide hydrogel self-assembly.Chem Sci. 2022 Aug 16;13(34):10020-10028. doi: 10.1039/d1sc06562a. eCollection 2022 Aug 31. Chem Sci. 2022. PMID: 36128231 Free PMC article.
-
Two-dimensional infrared spectra of isotopically diluted amyloid fibrils from Abeta40.Proc Natl Acad Sci U S A. 2008 Jun 3;105(22):7720-5. doi: 10.1073/pnas.0802993105. Epub 2008 May 22. Proc Natl Acad Sci U S A. 2008. PMID: 18499799 Free PMC article.
References
Publication types
MeSH terms
Substances
LinkOut - more resources
Full Text Sources
Research Materials
