

Role of the midbrain dopaminergic system in modulation of vocal brain activation by social context
- PMID: 17553009
- PMCID: PMC2561249
- DOI: 10.1111/j.1460-9568.2007.05600.x
Role of the midbrain dopaminergic system in modulation of vocal brain activation by social context
Abstract
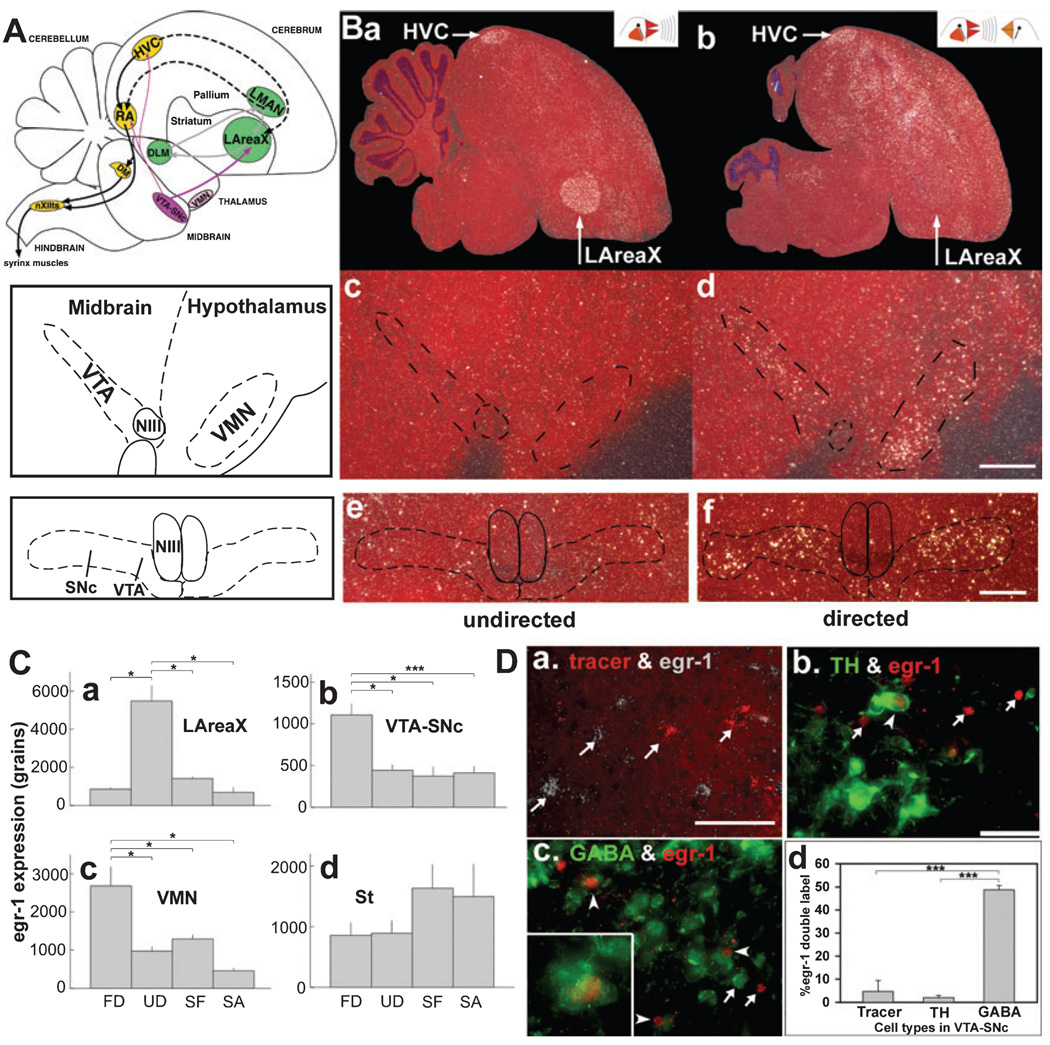
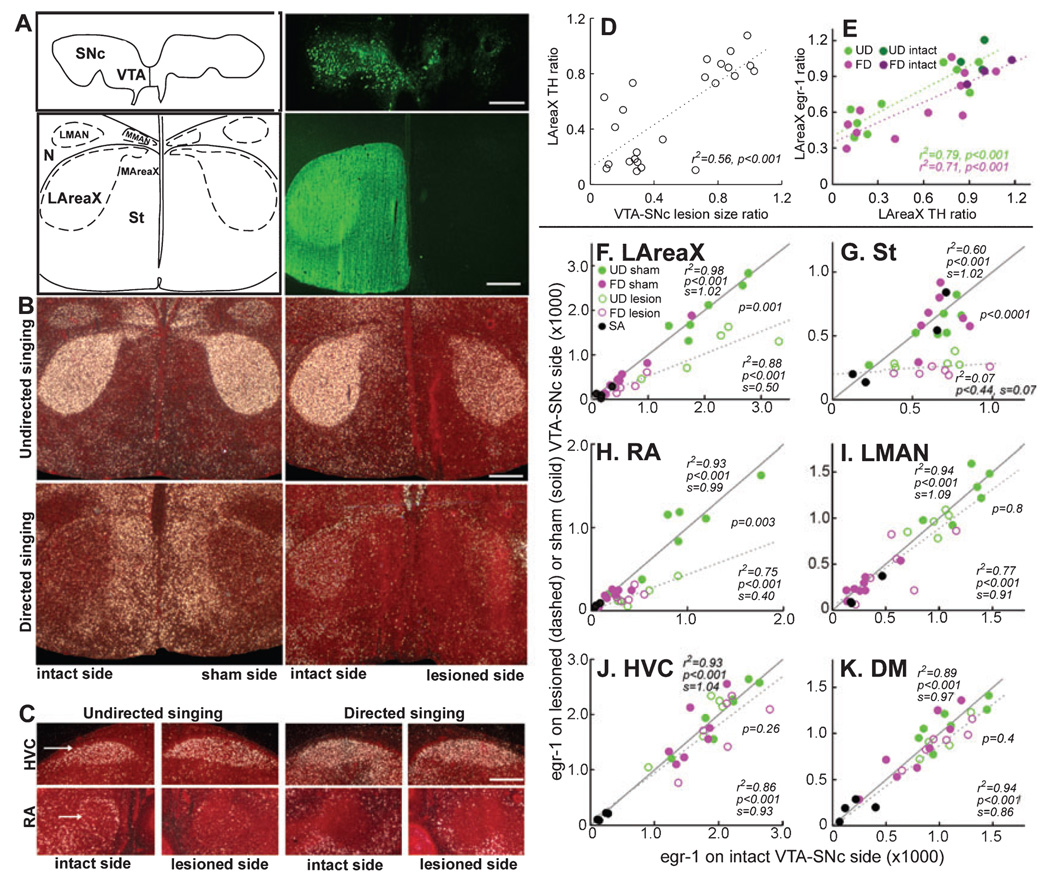
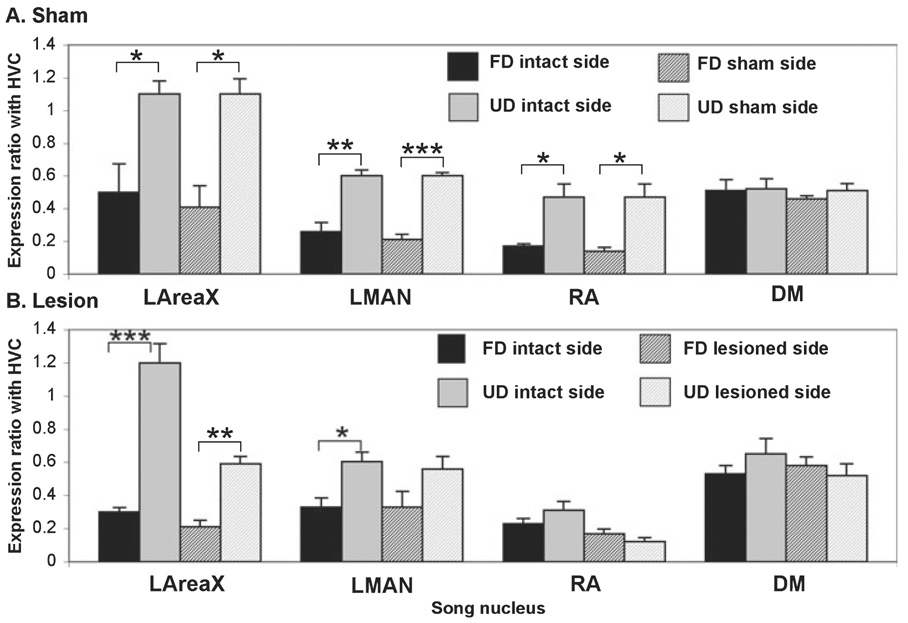
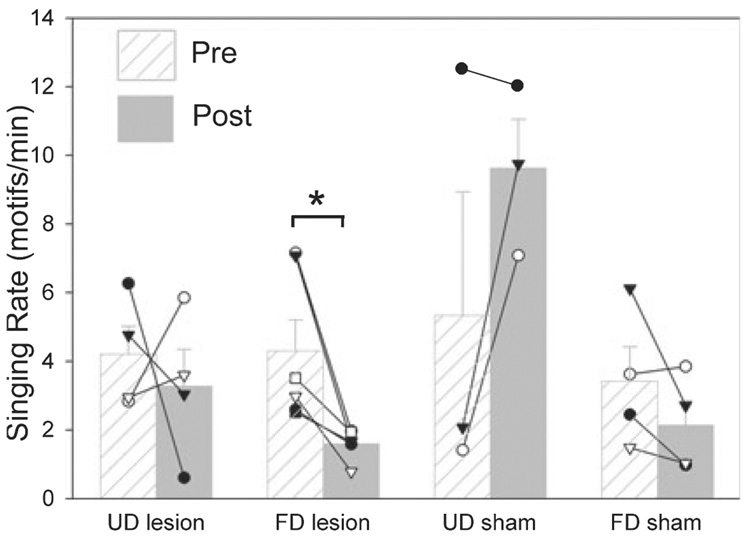
In a well-studied model of social behaviour, male zebra finches sing directed song to court females and undirected song, used possibly for practice or advertisement. Although the two song types are similar, the level of neural activity and expression of the immediate early gene egr-1 are higher during undirected than during directed singing in the lateral part of the basal ganglia song nucleus AreaX (LAreaX) and its efferent pallial song nuclei lateral magnocellular nucleus of the anterior nidopallium (LMAN) and the robust nucleus of the arcopallium (RA). As social interactions are dependent on brain motivation systems, here we test the hypothesis that the midbrain ventral tegmental area-substantia nigra pars compacta (VTA-SNc) complex, which provides a strong dopaminergic input to LAreaX, is a source of this modulation. Using egr-1 expression, we show that GABAergic interneurons in VTA-SNc are more active during directed courtship singing than during undirected singing. We also found that unilateral removal of VTA-SNc input reduced singing-dependent gene expression in ipsilateral LAreaX during both social contexts but it did not eliminate social context differences in LAreaX. In contrast, such lesions reduced and eliminated the social context differences in efferent nuclei LMAN and RA, respectively. These results suggest that VTA-SNc is not solely responsible for the social context gene regulation in LAreaX, but that VTA-SNc input to LAreaX enhances the singing-regulated gene expression in this nucleus and, either through LAreaX or through direct projections to LMAN and RA, VTA-SNc is necessary for context-dependent gene regulation in these efferent nuclei.
Figures
Similar articles
-
Forebrain circuits underlying the social modulation of vocal communication signals.Dev Neurobiol. 2016 Jan;76(1):47-63. doi: 10.1002/dneu.22298. Epub 2015 Jun 11. Dev Neurobiol. 2016. PMID: 25959605
-
A novel basal ganglia pathway forms a loop linking a vocal learning circuit with its dopaminergic input.J Comp Neurol. 2008 Jun 10;508(5):824-39. doi: 10.1002/cne.21700. J Comp Neurol. 2008. PMID: 18398824
-
Connections of a motor cortical region in zebra finches: relation to pathways for vocal learning.J Comp Neurol. 2000 May 1;420(2):244-60. J Comp Neurol. 2000. PMID: 10753310
-
Auditory signal processing in communication: perception and performance of vocal sounds.Hear Res. 2013 Nov;305:144-55. doi: 10.1016/j.heares.2013.06.007. Epub 2013 Jul 1. Hear Res. 2013. PMID: 23827717 Free PMC article. Review.
-
Environment- and activity-dependent dopamine neurotransmitter plasticity in the adult substantia nigra.J Chem Neuroanat. 2016 Apr;73:21-32. doi: 10.1016/j.jchemneu.2015.12.009. Epub 2015 Dec 21. J Chem Neuroanat. 2016. PMID: 26718607 Review.
Cited by
-
Neural mechanisms of aggression across species.Nat Neurosci. 2020 Nov;23(11):1317-1328. doi: 10.1038/s41593-020-00715-2. Epub 2020 Oct 12. Nat Neurosci. 2020. PMID: 33046890 Review.
-
7α-Hydroxypregnenolone, a key neuronal modulator of locomotion, stimulates upstream migration by means of the dopaminergic system in salmon.Sci Rep. 2015 Jul 29;5:12546. doi: 10.1038/srep12546. Sci Rep. 2015. PMID: 26220247 Free PMC article.
-
Midbrain dopamine neurons reflect affiliation phenotypes in finches and are tightly coupled to courtship.Proc Natl Acad Sci U S A. 2009 May 26;106(21):8737-42. doi: 10.1073/pnas.0811821106. Epub 2009 May 13. Proc Natl Acad Sci U S A. 2009. PMID: 19439662 Free PMC article.
-
Evidence that dopamine within motivation and song control brain regions regulates birdsong context-dependently.Physiol Behav. 2008 Sep 3;95(1-2):258-66. doi: 10.1016/j.physbeh.2008.06.009. Epub 2008 Jun 21. Physiol Behav. 2008. PMID: 18619478 Free PMC article.
-
Patterns of phosphorylated tyrosine hydroxylase vary with song production in female starlings.Brain Res. 2013 Mar 1;1498:41-9. doi: 10.1016/j.brainres.2012.12.020. Epub 2012 Dec 25. Brain Res. 2013. PMID: 23270608 Free PMC article.
References
-
- Appeltants D, Ball GF, Balthazart J. The origin of catecholaminergic inputs to the song control nucleus RA in canaries. Neuroreport. 2002;13:649–653. - PubMed
-
- Aron A, Fisher H, Mashek DJ, Strong G, Li H, Brown LL. Reward, motivation, and emotion systems associated with early-stage intense romantic love. J. Neurophysiol. 2005;94:327–337. - PubMed
-
- Bayer VE, Pickel VM. GABA-labeled terminals form proportionally more synapses with dopaminergic neurons containing low densities of tyrosine hydroxylase-immunoreactivity in rat ventral tegmental area. Brain Res. 1991;559:44–55. - PubMed
-
- Castelino CB, Ball GF. A role for norepinephrine in the regulation of context-dependent ZENK expression in male zebra finches (Taeniopygia guttata) Eur. J. Neurosci. 2005;21:1962–1972. - PubMed
Publication types
MeSH terms
Substances
Grants and funding
LinkOut - more resources
Full Text Sources
Other Literature Sources
Research Materials
Miscellaneous
