Comparative Study
. 2007 Jun 7:8:148.
doi: 10.1186/1471-2164-8-148.

Robust interlaboratory reproducibility of a gene expression signature measurement consistent with the needs of a new generation of diagnostic tools

Affiliations
Comparative Study

Robust interlaboratory reproducibility of a gene expression signature measurement consistent with the needs of a new generation of diagnostic tools

Robert A Ach et al. BMC Genomics. .

Abstract

Background: The increasing use of DNA microarrays in biomedical research, toxicogenomics, pharmaceutical development, and diagnostics has focused attention on the reproducibility and reliability of microarray measurements. While the reproducibility of microarray gene expression measurements has been the subject of several recent reports, there is still a need for systematic investigation into what factors most contribute to variability of measured expression levels observed among different laboratories and different experimenters.

Results: We report the results of an interlaboratory comparison of gene expression array measurements on the same microarray platform, in which the RNA amplification and labeling, hybridization and wash, and slide scanning were each individually varied. Identical input RNA was used for all experiments. While some sources of variation have measurable influence on individual microarray signals, they showed very low influence on sample-to-reference ratios based on averaged triplicate measurements in the two-color experiments. RNA labeling was the largest contributor to interlaboratory variation.

Conclusion: Despite this variation, measurement of one particular breast cancer gene expression signature in three different laboratories was found to be highly robust, showing a high intralaboratory and interlaboratory reproducibility when using strictly controlled standard operating procedures.


Figures
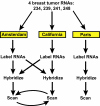
Figure 1
Figure 1
Outline of experimental design. All four tumor RNAs plus the reference RNA were amplified and labeled twice with each dye, in both the Amsterdam and California laboratories. Half of the labeled material was exchanged between the two labs, and samples labeled locally and in the other laboratory were hybridized in replicate, and scanned. Slides were shipped to the other laboratory for rescanning. In the third lab (Paris), the tumor samples were independently labeled and hybridized three times.
Figure 2
Figure 2
Replicate correlations for tumor 248. Plot shows signals from all background subtracted non-control features of 8 replicate hybridization pairs (16 arrays total) for tumor 248. All of the individual features from all of the16 arrays are plotted. One of each replicate pair is plotted on the x-axis, the other is on the y-axis. Green data points are the Cy3 channel, red data points are the Cy5 channel.
Figure 3
Figure 3
Scan/rescan correlations for tumor 248. Plot shows background subtracted signals from the original laboratory scan (x-axis) plotted against the signals from the rescan performed in the other laboratory. All of the individual features from all of the16 arrays are plotted. All 16 arrays for tumor 248 were scanned in the hybridization lab, then shipped to the other lab and rescanned (32 scans total from 16 arrays, on 2 slides). Green data points are from the Cy3 channel, red data points are from the Cy5 channel.
Figure 4
Figure 4
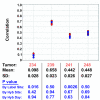
70 gene signature correlation values. The 70-gene signature correlation values for the four tumors were determined for each hybridization; these values indicate the correlation of the log ratios of the 70 signature genes from the tumor sample with the average log ratios from a previously defined set of patients [14]. The correlation values for each dye-swapped pair (y-axis) are plotted for each of the four tumors (x-axis). Red data points were labeled in Amsterdam, while blue data points were labeled in California. The mean and standard deviations of the correlation values for each tumor are indicated beneath the plot. Each set of hybridizations for each tumor was divided into two groups, based either on hybridization site, labeling site, or hybridization day. An ANOVA was then performed on the 70 gene signature correlation values obtained in the hybs for both groups, and the resulting P values for each tumor are shown.
Figure 5
Figure 5
Distribution of log10 ratio differences between conditions for all four tumors. Distributions of log10 ratio differences for the 182 of the 232 genes that had signals significantly above background (signals > 15) are plotted. Each set of log10 ratios were compared with another set by subtracting the log10 ratios of one set from those of the other to get a set of 182 log10 ratio differences. The green distributions compare arrays with the same labeled sample, hybridized in different laboratories. The blue distributions compare arrays labeled at different locations but hybridized at the same location. The black distributions compare arrays with different labeled samples, hybridized in different locations. Each curve is a probability distribution (normalized histogram) of the differences between the average log10 ratios of the 182 probes in one condition, and their average in the other condition.
Figure 6
Figure 6
P values from ANOVA analysis of each of the 70 signature genes. For each tumor the log10 ratios of the 70 signature genes were averaged for each dye-swapped hybridization pair, after reversing the sign of one of the dye swaps. An ANOVA analysis was then performed for each individual gene for each tumor, to determine if the log ratios for each gene varied by hybridization site or by labeling site. The plots show the number of genes for each tumor having P values of < 0.001, 0.001–0.01, 0.01–0.05, and 0.05–1.0 from the ANOVA analysis, when grouped by hybridization site (left) or by labeling site (right).
Figure 7
Figure 7
70 gene signature correlation values between three laboratories. 70-gene signature correlation values for the four tumors were determined for each hybridization done in three different laboratories. On the x-axis are the four different tumor samples, and on the y-axis are the correlation values for each dye-swapped pair. Green data points were labeled and hybridized in Paris, red data points were labeled in Amsterdam, and blue data points were labeled in California. The mean correlation values at each hybridization location, and the ANOVA P values when grouped by labeling and hybridization site are shown beneath the plot.

References

    1. van't Veer LJ, Dai H, van de Vijver MJ, He YD, Hart AAM, Mao M, Peterse HL, van der Kooy K, Marton MJ, Witteveen AT, Schreiber GJ, Kerkhoven RM, Roberts C, Linsley PS, Bernards R, Friend SL. Gene expression profiling predicts clinical outcome of breast cancer. Nature. 2002;415:530–536. doi: 10.1038/415530a. - DOI - PubMed
    1. van de Vijver MJ, He YD, van't Veer LJ, Dai H, Hart AAM, Voskuil DW, Schreiber GJ, Peterse JL, Roberts C, Marton MJ, Parrish M, Atsma D, Witteveen A, Glas A, Delahaye L, van der Velde T, Bartelink H, Rodenhuis S, Rutgers ET, Friend SH, Bernards R. A gene-expression signature as a predictor of survival in breast cancer. New Eng Jour Med. 2002;347:1999–2009. doi: 10.1056/NEJMoa021967. - DOI - PubMed
    1. Bullinger L, Dohner K, Bair E, Frohling S, Schlenk RF, Tibshirani R, Dohner H, Pollack JR. Use of gene-expression profiling to identify prognostic subclasses in adult acute myeloid leukemia. N Engl J Med. 2004;350:1605–1616. doi: 10.1056/NEJMoa031046. - DOI - PubMed
    1. Nutt CL, Mani DR, Betensky RA, Tamayo P, Cairncross JG, Ladd C, Pohl U, Hartmann C, McLaughlin ME, Batchelor TT, Black PM, von Deimling A, Pomeroy SL, Golub TR, Louis DN. Gene expression-based classification of malignant gliomas correlates better with survival than histological classification. Cancer Res. 2003;63:1602–1607. - PubMed
    1. Singh D, Febbo PG, Ross K, Jackson DG, Manola J, Ladd C, Tamayo P, Renshaw AA, D'Amico AV, Richie JP, Lander ES, Loda M, Kantoff PW, Golub TR, Sellers WR. Gene expression correlates of clinical prostate cancer behavior. Cancer Cell. 2002;1:203–209. doi: 10.1016/S1535-6108(02)00030-2. - DOI - PubMed

Publication types

MeSH terms