. 2007 Jul;18(7):1249-64.
doi: 10.1016/j.jasms.2007.04.012. Epub 2007 Apr 24.

Mapping the human plasma proteome by SCX-LC-IMS-MS

Affiliations

Mapping the human plasma proteome by SCX-LC-IMS-MS

Xiaoyun Liu et al. J Am Soc Mass Spectrom. 2007 Jul.

Abstract

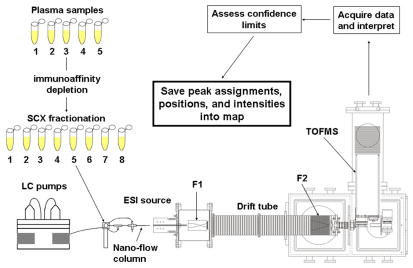
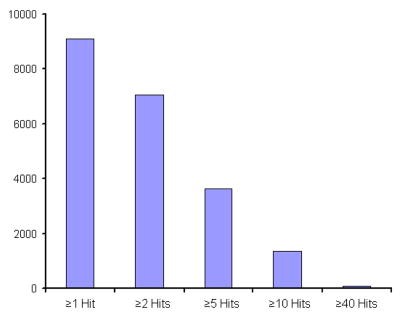
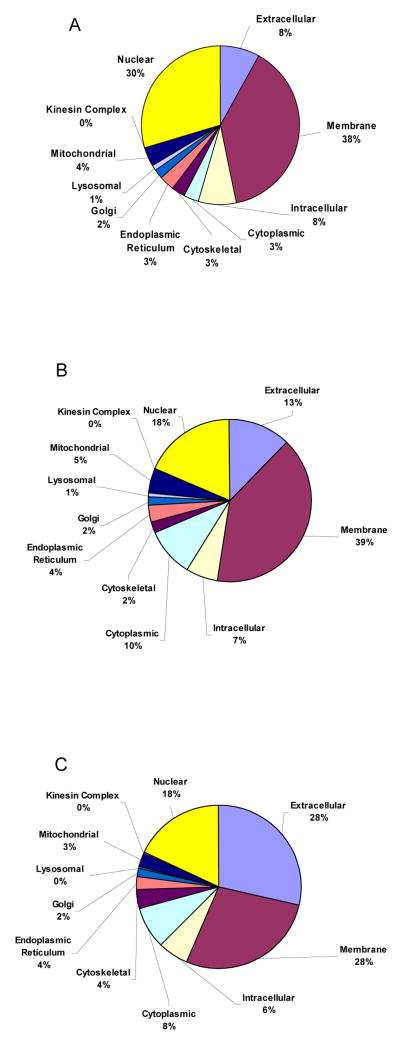
The advent of on-line multidimensional liquid chromatography-mass spectrometry has significantly impacted proteomic analyses of complex biological fluids such as plasma. However, there is general agreement that additional advances to enhance the peak capacity of such platforms are required to enhance the accuracy and coverage of proteome maps of such fluids. Here, we describe the combination of strong-cation-exchange and reversed-phase liquid chromatographies with ion mobility and mass spectrometry as a means of characterizing the complex mixture of proteins associated with the human plasma proteome. The increase in separation capacity associated with inclusion of the ion mobility separation leads to generation of one of the most extensive proteome maps to date. The map is generated by analyzing plasma samples of five healthy humans; we report a preliminary identification of 9087 proteins from 37,842 unique peptide assignments. An analysis of expected false-positive rates leads to a high-confidence identification of 2928 proteins. The results are catalogued in a fashion that includes positions and intensities of assigned features observed in the datasets as well as pertinent identification information such as protein accession number, mass, and homology score/confidence indicators. Comparisons of the assigned features reported here with other datasets shows substantial agreement with respect to the first several hundred entries; there is far less agreement associated with detection of lower abundance components.


Figures

Figure 1
Figure 1
Schematic representation of the experimental protocol used to generate plasma proteome map. In many ways this analysis is analogous to other SCX-LC-MS/MS methods. The difference is found in the inclusion of a split-field drift tube for IMS separation and the use of field modulation for generation of fragment spectra. See text and references therein for details.
Figure 2
Figure 2
Part A shows a two-dimensional, tR(tD) plot of the raw data (A) for a single SCX fraction (sample 3). The plot is obtained by summing all TOF bins at each tR and tD value. Intensities are represented as a color map with the most intense level set at 150 counts. The representation indicates that individual two-dimensional bins are saturated across a wide range of retention and drift times. Part B shows the same data when plotted as a two-dimensional, tR(tD) base-peak diagram. This plot is obtained by extracting the intensity value obtained for the most intense m/z value in the MS measurement (extracted for every tR (tD) position to create the contour plot). The traces below each contour plot show the ion chromatograms obtained by integrating all tD bins at each tR for the respective 2D plots. For more details about the generation of these datasets see text references and discussion therein.
Figure 3
Figure 3
The plots on the right show fragmentation spectra of three identified peptides that have been identified based on database assignments (see text). These spectra are generated experimentally when the second field region of the split-field drift tube is modulated to high-field conditions sufficient to induce fragmentation. The low-field modulation data associated with measurement of the precursor ions (acquired in alternating fashion throughout the entire dataset) is not shown. The spectra that are shown are consistent with the VSFLASALEEYTK, DSVTGTLPK, and VEVVDEER sequences that are unique to the proteins apolipoprotein A-I, plasma kallikrein, and troponin I. The labels given to fragment ions in the spectra are generated by the database assignment and show a preponderance of y-type fragments (generally the observation for fragments generated at high-fields in these studies). The sequences to the left correspond to the total amino acid sequences of each of the respective proteins and those regions that are covered by assignments of peptides based on this approach are shown in red. Also indicated is number of unique peptide ions identified for each protein and the percentage of the sequence that has been identified by the analysis. See text for details.
Figure 4
Figure 4
A three-dimensional dot plot representation of the positions of peaks (in the retention time, drift time, and m/z dimensions) that are obtained from the 1×10⁵ most intense features (orange) observed during the triplicate LC-IMS-MS analyses of all SCX fractions associated with sample 1. Superimposed on the plot are the positions for >10,000 features that have been assigned to peptides (blue). The arrows indicate some of the precursor ion positions of peptides identified for the four proteins labeled. This representation is intended to provide the reader with the impression that the possible existence of an abundant protein in plasma (such as apolipoprotein A-I) could be tested at many positions in the map and therefore upon comparison there should be little ambiguity regarding its detection; whereas, a low-abundance protein (such as troponin I) may be represented at only a single position leading to significant uncertainty about its detection. See text for discussion.
Figure 5
Figure 5
Bar graph showing the total number of proteins as a function of observed peptide hits per protein. The numbers for all assigned proteins are given in the supplementary information (Table S2).
Figure 6
Figure 6
The top graph shows the percentage of false positive assignments for each peptide hit level from the random peptide hit removal analysis (see text for description) using the 10% (red) and 30% (blue) false positive rate estimates. Note that the 30% limit is a factor of three times greater than the upper limit of the (6 to 10%) range established in the false-positive rate estimate and is included to provide a feeling about an extreme limit (see text for discuussion). The arrow shows the peptide hit threshold for which no proteins were randomly removed at 6 hits and above (at a 10% false positive rate) and less than 1 in 20 protein assignments is considered a false positive (from the 30% trace). The bottom graph shows a log-log plot of the total number of peptide hits for each identified protein (Table S1, supplementary information). The dashed line shows the peptide hit level for the 100th protein (35 hits). The 6-hit threshold (obtained from the top plot) is also shown with an arrow which indicates the cutoff between the 2928 proteins that are defined as high-confidence assignments (to the left of the threshold) and the 6159 low-confidence assignments (to the right of the threshold). An additional arrow at protein number 60 indicates the number of proteins that were detected using 2D gel techniques, most of which are classical plasma proteins (see text). The change in slope near this value reflects a transition in concentrations between these more abundant components (mostly classical plasma proteins) and those that arise from tissue leakage.
Figure 7
Figure 7
Major gene ontology (GO) component percentages for the entire human proteome (A), the plasma proteome generated from IMS-MS experiments (B), as well as the proteome map weighted by the number of protein hits (C). See text for discussion.

Similar articles

Cited by

References

    1. Wasinger VC, Cordwell SJ, Cerpa-Poljak A, Yan JX, Gooley AA, Wilkins MR, Duncan MW, Harris R, Williams KL, Humphery-Smith I. Progress with Gene-Product Mapping of the Mollicutes: Mycoplasma Genitalium. Electrophoresis. 1995;16:1090–1094. - PubMed
    1. For proteomic platform technology development information see the following reviews andreferences therein: Hancock WS, Apffel AJ, Chakel JA, Hahnenberger KC, Choudhary G, Traina J, Pungor E. Integrated Genomic/Proteomic Analysis. Anal Chem. 1999;71:742A–748A.Schweitzer B, Kingsmore SF. Measuring Proteins on Microarrays. Curr Opin Biotech. 2002;13:14–19.Figeys D. Proteomics in 2002: a Year of Technical Development and Wide-Ranging Applications. Anal Chem. 2003;75:2891–2905.Romijn EP, Krijgsveld J, Heck AJR. Recent Liquid Chromatographic-(Tandem) Mass Spectrometric Applications in Proteomics. J Chromat A. 2003;1000:589–608.Aebersold R, Mann M. Mass Spectrometry-Based Proteomics. Nature. 2003;422:198–207.Page JS, Masselon CD, Smith RD. FTICR Mass Spectrometry for Qualitative and Quantitative Bioanalyses. Curr Opin Biotech. 2004;15:3–11.Anderson L. Candidate-Based Proteomics in the Search for Biomarkers of Cardiovascular Disease. J Physiol-London. 2005;563:23–60.

    1. Anderson NL, Anderson NG. The Human Plasma Proteome: History, Character, and Diagnostic Prospects. Mol Cel Proteomics. 2002;1:845–867. - PubMed
    1. Liu X, Plasencia M, Ragg S, Valentine SJ, Clemmer DE. Development of High-Throughput Dispersive LC-Ion Mobility-TOFMS Techniques for Analyzing the Human Plasma Proteome. Brief Funct Genomics Proteomics. 2004;3:177–186. - PubMed
    1. The latest version of the Swiss-Prot protein database can be found at the following web address: http://www.expasy.uniprot.org/database/knowledgebase.shtml.

Publication types

MeSH terms