. 2007 Dec 29;362(1488):2233-58.
doi: 10.1098/rstb.2006.1947.

Thermal limits and adaptation in marine Antarctic ectotherms: an integrative view

Affiliations

Thermal limits and adaptation in marine Antarctic ectotherms: an integrative view

Hans O Pörtner et al. Philos Trans R Soc Lond B Biol Sci. .

Abstract

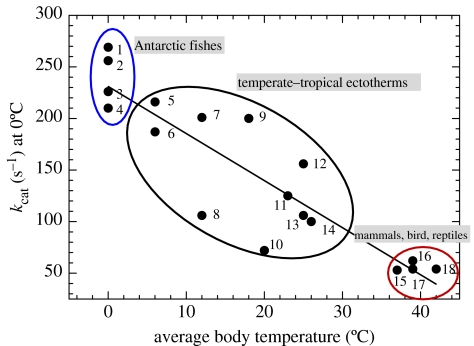
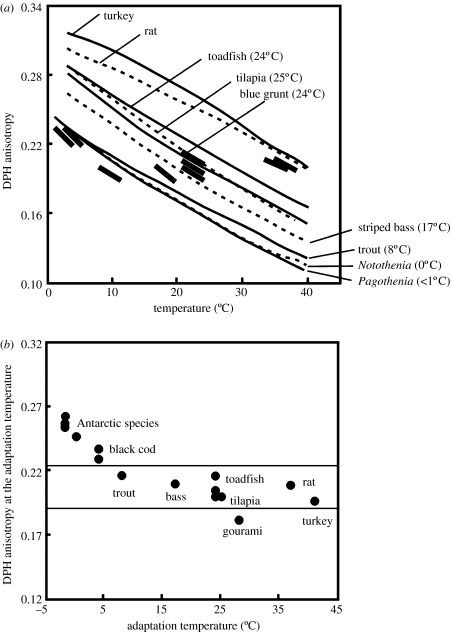
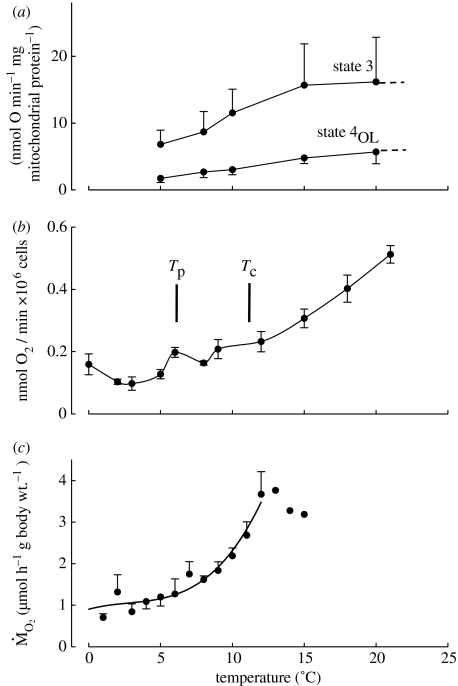
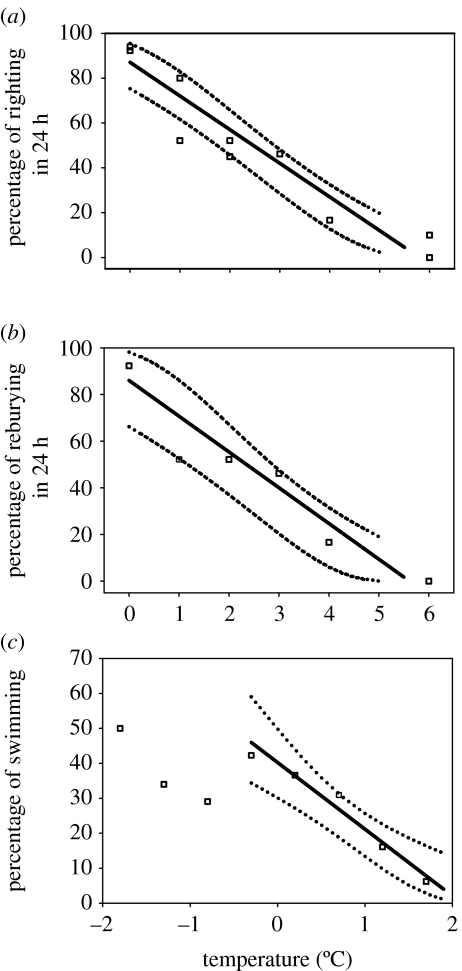
A cause and effect understanding of thermal limitation and adaptation at various levels of biological organization is crucial in the elaboration of how the Antarctic climate has shaped the functional properties of extant Antarctic fauna. At the same time, this understanding requires an integrative view of how the various levels of biological organization may be intertwined. At all levels analysed, the functional specialization to permanently low temperatures implies reduced tolerance of high temperatures, as a trade-off. Maintenance of membrane fluidity, enzyme kinetic properties (Km and k(cat)) and protein structural flexibility in the cold supports metabolic flux and regulation as well as cellular functioning overall. Gene expression patterns and, even more so, loss of genetic information, especially for myoglobin (Mb) and haemoglobin (Hb) in notothenioid fishes, reflect the specialization of Antarctic organisms to a narrow range of low temperatures. The loss of Mb and Hb in icefish, together with enhanced lipid membrane densities (e.g. higher concentrations of mitochondria), becomes explicable by the exploitation of high oxygen solubility at low metabolic rates in the cold, where an enhanced fraction of oxygen supply occurs through diffusive oxygen flux. Conversely, limited oxygen supply to tissues upon warming is an early cause of functional limitation. Low standard metabolic rates may be linked to extreme stenothermy. The evolutionary forces causing low metabolic rates as a uniform character of life in Antarctic ectothermal animals may be linked to the requirement for high energetic efficiency as required to support higher organismic functioning in the cold. This requirement may result from partial compensation for the thermal limitation of growth, while other functions like hatching, development, reproduction and ageing are largely delayed. As a perspective, the integrative approach suggests that the patterns of oxygen- and capacity-limited thermal tolerance are linked, on one hand, with the capacity and design of molecules and membranes, and, on the other hand, with life-history consequences and lifestyles typically seen in the permanent cold. Future research needs to address the detailed aspects of these interrelationships.


Figures

Figure 1
Figure 1
Temperature-adaptive variation in catalytic rate constant (kcat) values for A4-LDH. At a common temperature of measurement (0°C), orthologues of cold-adapted species like Antarctic notothenioid fishes operate at four to five times higher kcat values than orthologues from warm-adapted mammals, birds and reptiles. Species studied were: (1) Parachaenichthys charcoti (Antarctic fish), (2) Lepidonotothen nudifrons (Antarctic fish), (3) Champsocephalus gunnari (Antarctic fish), (4) Harpagifer antarcticus (Antarctic fish), (5) Patagonotothen tessellate (South American notothenioid fish), (6) Eleginops maclovinus (South American notothenioid fish), (7) Sebastes mystinus (rockfish), (8) Hippoglossus stenolepis (halibut), (9) Sphyraena argentea (temperate barracuda), (10) Squalus acanthias (dogfish), (11) Sphyraena lucasana (subtropical barracuda), (12) Gillichthys mirabilis (temperate goby), (13) Thunnus thynnus (tuna), (14) Sphyraena ensis (tropical barracuda), (15) Bos taurus (cow), (16) Gallus gallus (chicken), (17) Meleagris gallopavo (turkey) and (18) Dipsosaurus dorsalis (desert iguana). (figure modified after Fields & Somero, 1998).
Figure 2
Figure 2
Homeoviscous adaptation of membrane structure. A high degree of compensation to temperature in membrane static order (‘fluidity’), as indexed by the fluorescence anisotropy of the probe molecule 1,6-diphenyl-1,3,5-hexatriene (DPH), is found in the comparisons of synaptosomal membranes from brain tissues of differently thermally adapted vertebrates. (a) Acute effects of measurement of temperature on DPH fluorescence anisotropy. Thick line segments show approximate body temperatures of the species. (b) DPH fluorescence anisotropy at each species' adaptation temperature. (figure modified after Logue et al. 2000).
Figure 3
Figure 3
Comparison of metabolic rate data obtained in (a) isolated mitochondria (Lannig et al. 2005), (b) isolated hepatocytes (Mark et al. 2005) and (c) intact specimens (Mark et al. 2002) of the Antarctic eelpout (P. brachycephalum). High thermal limits are apparent in whole-organism oxygen consumption where it levels off close to critical temperatures, characterized by the onset of anaerobic metabolism (cf. figure 5). Pejus and critical temperatures (Tp and Tc) seen in vivo (according to Van Dijk et al. 1999; Mark et al. 2002) occur within a temperature range, where functional integrity of mitochondria and cells is still undisturbed. The pattern of hepatocyte respiration rates as studied in the Antarctic eelpout, P. brachycephalum, acclimated to 0°C reveals an energetic minimum that matches the putative thermal window of the species.
Figure 4
Figure 4
(a) Righting responses in the Antarctic limpet, N. concinna, with temperature. Data shown are the proportion of limpets righting in 24 h. For each point, n=20–31. All regressions were made following square root and arcsin transforms of percentage data (arcsin(√%righting) =1.20 −0.180T°C; r2=0.90, F=77.9, p<0.001, d.f.=9). (b) Reburying in the bivalve mollusc, L. elliptica, with temperature. Data show the proportion of animals reburying in 24 h (n=18–26 for each point). Regression line: arcsin(√%burying) =0.95−0.173T°C (r2=0.85, F=22.4, p=0.009, d.f.=5). (c) The proportion of Antarctic scallops, A. colbecki, swimming in response to freshwater stimulation. Each point is the proportion swimming at that temperature (n=57–175 for each point). A regression was fitted to data for temperatures above −0.3°C, where a clear temperature effect was apparent. This regression was fitted to square root- and arcsin-transformed percentage values. Regression line: arcsin(√%swimming) =0.682–0.230T°C (r2=0.93, F=51.5, p=0.006, d.f.=4). In all figures, dotted lines indicate 95% CIs for regressions. For all plots, lines and CIs shown were plotted following sine and square back transforms. (figure modified from Peck et al. 2004b.)
Figure 5
Figure 5
Conceptual model of thermal limitation and functional optima (modified after Pörtner 2002a; Pörtner et al. 2005a). (a) Progressively enhanced thermal limitation occurs through the consecutive onset of a loss in aerobic scope beyond Tp, the onset of anaerobic metabolism at Tc and of molecular denaturation at Td. Antarctic stenotherms, especially among invertebrates, live close to their thermal optimum. The parallel shift of low and high thermal tolerance thresholds (Tp and Tc) during temperature adaptation occurs by adjustments of capacity at various functional levels. Td probably shifts with molecular modifications as well as the adjustment of molecular protection mechanisms like heat shock proteins or antioxidants (see text). Maximum scope in ATP generation at the upper Tp supports maximum capacity of organismic oxygen supply by circulatory and ventilatory muscles. It may also support (b) an asymmetric performance curve of the whole organism with optimal performance (e.g. growth, exercise) close to upper pejus temperature Tp.
Figure 6
Figure 6
Duration from embryonic development to hatching as a function of temperature for several species of echinoids from different latitudes. Time to hatching is plotted against mean experimental or environmental temperature for that species (adapted from Bosch et al. 1987; Stanwell-Smith & Peck 1998). Data for tropical and temperate species (filled triangles), Sterechinus neumayeri from McMurdo Sound (open triangles; Bosch et al. 1987) and S. neumayeri from Signy Island (open circles; Stanwell-Smith & Peck 1998).
Figure 7
Figure 7
Arrhenius plots for the comparison of (a) average standard metabolic rates (SMR; (lnSMRavg)=30.116–8874.24 1/T, 82 measurements, 13 species, r2=0.725, p<0.001, Q10=2.28) with their annual rates of growth defined by (b) the overall growth performance (P, ln(OGP P) =4.22–958.466 1/T, 198 studies, 25 species, r2=0.132, p<0.001, Q10=1.12) in pectinid species from various temperature regimes (modified after Heilmayer et al. 2004). Note that growth rates in polar species (on the right) result higher than expected parallel decrease in SMR with temperature, thereby indicating high growth efficiency.
Figure 8
Figure 8
Effects of (a) temperature and (b) oxygen availability on the largest amphipod crustacean sizes for nine marine (filled circle) and three reduced salinity sites (open circle). (a) 95%/5% threshold size (TS95/5, TS95/5 is the cut-off point between the 95% smallest species and the 5% largest species in the size distribution) versus mean annual water temperature (inverted scale). This threshold size is used as a proxy for maximum size to allow for occasions where large, but very rare, species may not have been sampled. (b) TS95/5 versus calculated dissolved oxygen content at saturation (O2 μmol kg−1), based on mean surface water temperature and salinity. Although not every habitat in a site will experience permanently high oxygen saturation, this 100% value represents optimal conditions for species to attain large size (adapted from Chapelle & Peck, 1999).

Similar articles

Cited by

References

    1. Abele D, Burlando B, Viarengo A, Pörtner H.O. Exposure to elevated temperatures and hydrogen peroxide elicits oxidative stress and antioxidant response in the Antarctic intertidal limpet Nacella concinna. Comp. Biochem. Physiol. B. 1998;120:425–435.
    1. Acierno R, Agnisola C, Tota B, Sidell B.D. Myoglobin enhances cardiac performance in Antarctic fish species that express the protein. Am. J. Physiol. 1997;273:R100–R106. - PubMed
    1. Aizawa A.S, Nishino H, Saito K, Kimura K, Shirakawa H, Yoshida M. Stimulation of transcription in cultured cells by high mobility group protein 1: essential role of the acidic carboxyl-terminal region. Biochemistry. 1994;33:14 690–14 695. - PubMed
    1. Angel M.V. Variations in time and space: is biogeography relevant to studies of long-time scale change? J. Mar. Biol. Assoc. UK. 1991;71:191–206.
    1. Arntz W.E, Brey T, Gallardo V.A. Antarctic zoobenthos. Oceangr. Mar. Biol.: Annu. Rev. 1994;32:241–304.

Publication types