. 2007 Sep;81(17):8878-90.
doi: 10.1128/JVI.00122-07. Epub 2007 Jun 6.

Vpr cytopathicity independent of G2/M cell cycle arrest in human immunodeficiency virus type 1-infected CD4+ T cells

Affiliations

Vpr cytopathicity independent of G2/M cell cycle arrest in human immunodeficiency virus type 1-infected CD4+ T cells

Diane L Bolton et al. J Virol. 2007 Sep.

Abstract

The mechanism of CD4(+) T-cell depletion in human immunodeficiency virus type 1 (HIV-1)-infected individuals remains unknown, although mounting evidence suggests that direct viral cytopathicity contributes to this loss. The HIV-1 Vpr accessory protein causes cell death and arrests cells in the G(2)/M phase; however, the molecular mechanism underlying these properties is not clear. Mutation of hydrophobic residues on the surface of its third alpha-helix disrupted Vpr toxicity, G(2)/M arrest induction, nuclear localization, and self-association, implicating this region in multiple Vpr functions. Cytopathicity by virion-delivered mutant Vpr protein correlated with G(2)/M arrest induction but not nuclear localization or self-association. However, infection with whole virus encoding these Vpr mutants did not abrogate HIV-1-induced cell killing. Rather, mutant Vpr proteins that are impaired for G(2)/M block still prevented infected cell proliferation, and this property correlated with the death of infected cells. Chemical agents that inhibit infected cells from entering G(2)/M also did not reduce HIV-1 cytopathicity. Combined, these data implicate Vpr in HIV-1 killing through a mechanism involving inhibiting cell division but not necessarily in G(2)/M. Thus, the hydrophobic region of the third alpha-helix of Vpr is crucial for mediating G(2)/M arrest, nuclear localization, and self-association but dispensable for HIV-1 cytopathicity due to residual cell proliferation blockade mediated by a separate region of the protein.


Figures

FIG. 1.
FIG. 1.
Exposed hydrophobic residues in the third alpha-helix of Vpr are important for Vpr cell cycle arrest activity in T cells. (A) Cn3D ribbon diagram of the NMR structure of HIV-1 Vpr depicting the relative orientation of the three principle alpha-helices. Residues within the well-defined α-helical structures are colored in green, the flexible N- and C-terminal domains and internal loops are depicted in blue, and the hydrophobic residues (yellow) exposed on the outer surface of Vpr's third alpha-helix are indicated. A side view of the protein is shown on the left, and an end-on view of the helices is shown on the right (arrow indicates the hydrophobic patch; N-terminal domain not shown). (B) Schematic of the NL4-3 HIV-1 molecular clone, NL4-3e-n-GFP, used here. Further derivatives are described in Materials and Methods. (C) hVpr (codon-optimized) was delivered into Jurkat cells by infection with HIV-1 (NL4-3e-n-GFP) RT- virions (Vprv) as WT (wt) or mutant protein (mutants indicated in the single-letter amino acid code; stp8,11 contains stop codons at residues 8 and 11). Virions containing WT Vpr (2) were titrated (low [lo], medium [md], and high [hi]) to offer a matched WT Vpr protein control for the mutant Vpr samples. Histograms of cell cycle blockade by Vprv at 28 h postinfection (left) show DNA content measured by flow cytometry on PI-stained cells. G1, S, and G2 populations were modeled using a Watson Pragmatic cell cycle model, and the ratio of G2/M to G1 cells (R) is indicated in boldface type. Western blot of the Jurkat cells (right) shows Vprv protein delivery for each of the mutants (top). The same membrane was probed for the HIV-1 capsid protein (p24) (middle) and β-actin as a cellular protein loading control (bottom). (D) Jurkat T cells were cotransfected with pcDNA3.1-hVpr (Vprt) expression plasmids encoding WT or mutant Vpr and pEGFP-N1 as a transfection marker at a 3:1 ratio. DNA content analysis was performed on GFP+ cells (left), and Western blotting (right) of Vpr (top) and β-actin (bottom, loading control) was performed on transfected cell lysates 3 days posttransfection. The data are representative of three independent experiments.
FIG. 2.
FIG. 2.
Vpr G2/M cell cycle arrest activity correlates with death-inducing function. (A) Summary of mutant Vpr cell cycle arrest activity in a transfection-based assay (Vprt [▧]) and the virion-delivered system (Vprv) from two independent experiments: from Fig. 1C (▪) (a) and at 26 h postinfection (□) (b) and 66 h postinfection (▥). The ratio of G2/M to G1 is plotted on the x axis. (B) Kinetics of Vprv cytopathicity after virion delivery of hVpr mutants or no Vpr (ΔVpr) for samples shown in panel A, series b. Viability was measured by flow cytometric detection of PI-negative, forward-scatter large cell events, and the percentage of viable cells is plotted over time. The data are representative of three independent experiments.
FIG. 3.
FIG. 3.
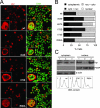
Exposed hydrophobic third-helix residues are important for Vpr nuclear localization. (A) Confocal microscopic images of Jurkat T cells transfected with pcDNA3.1 containing WT (wt) or mutant hVpr as indicated. At 48 h after transfection, cells were fixed and immunostained for Vpr (red, left) and imaged by confocal microscopy (×80). Insets depict higher-magnification images of representative cells for each sample (×100). The nucleus was stained with Hoechst (green), and an overlay image with Vpr is shown (right). (B) Quantitation of cytoplasmic versus nuclear localization for WT and mutant Vpr. Immunofluorescent staining of Vpr localization in panel A was visually assessed per cell and designated nuclear, mostly nuclear (nuc > cyto), mostly cytoplasmic (cyto > nuc), or cytoplasmic. The percentage of cells with each staining pattern is plotted for the indicated version of Vpr (n ≥ 120). (C) Jurkat cells transfected with WT (1), I70S (2), or R80A (3) hVpr were harvested 4 days posttransfection for fractionation (top) into cytoplasmic (left) and nuclear (right) protein or DNA content analysis (bottom). Lysates were blotted for Vpr, PARP (nuclear marker), and β-actin (cytoplasmic loading control).
FIG. 4.
FIG. 4.
Vpr self-associates in live cells, but oligomerization is not required for G2/M arrest activity. 293T cells were transfected with pECFP-C1 and pEYFP-C1-derived constructs encoding either an ECFP-EYFP fusion protein (intramolecular FRET-positive control), ECFP-Vpr and EYFP (negative control), or ECFP-Vpr and EYFP-Vpr fusions containing WT (wt) or mutant Vpr as indicated. FRET analysis was performed 24 h after transfection by flow cytometry on double-positive cells expressing both ECFP and EYFP indicated by the gate in the contour plot on the left. The ECFP-Vpr and EYFP cotransfected cells serve as the baseline FRET signal (thin line) for Vpr cotransfected samples (bold line) in each histogram. The units for the x and y axes are shown for the plots in the bottom row and are identical for all plots. A shift in the FRET MFI indicates protein-protein interaction in real time in living cells.
FIG. 5.
FIG. 5.
Vpr mutants attenuated for G2/M arrest activity retain cytotoxicity function within HIV-1 infection. Jurkat T cells were mock infected or infected with VSV-G-pseudotyped NL4-3e-n-GFPf- (Vif-) derivatives expressing WT Vpr (wt), deleted Vpr (Δ), or Vpr point mutants as indicated (MOI = 3). (A) The viability of infected cultures was monitored over time by flow cytometry (PI negative, high forward scatter). (B) Infected cell percentage was measured by flow cytometric quantitation of GFP+ live cells for the cultures shown in panel A. (C) DNA content analysis of mock-infected or NL4-3e-n-GFPf- infected cells (gated on GFP+) 46 h postinfection for the samples in panels A and B. The ratio of cells in G2/M to G1 (R) is indicated within the DNA content histogram in boldface type. (D) Total viable cell counts at 26, 45, and 72 h postinfection for the cultures shown in panels A to C measured by constant time flow cytometric acquisition. (E) Jurkat T cells were infected with WT or mutant Vpr derivatives of NL4-3e-n-GFPf- as in panel A, and BrdU incorporation was measured after a 60-min pulse with 5 mM BrdU at 42 h postinfection. DNA content (7-AAD) is shown on the x axis, and BrdU staining is shown on the y axis. The percentage of BrdU-positive cells in the gate is indicated in the upper right corner. Analysis was performed on GFP+ cells (gate drawn within inset histogram) for infected cultures.
FIG. 6.
FIG. 6.
Accumulation in G2/M is not required for HIV-1 cytopathicity. (A) Jurkat cells were mock infected or infected with NL4-3e-n-GFP (MOI = 3) in the presence or absence of 3 mM caffeine (caf). DNA content analysis was performed 37 h postinfection and plotted against GFP (x axis). Lower and upper quadrants depict approximate G1 and G2/M populations, respectively, and the percentage within each gate is indicated. Inset histograms depict the DNA content for each sample, pregated on GFP+ cells for NL4-3e-n-GFP-infected samples. (B) Viable cell (PI-negative, high forward scatter) percentages of cultures are shown in panel A over time as measured by flow cytometry. The percentage of GFP+ cells is shown on the right. (C) Jurkat cells were mock infected or infected with NL4-3e-n-GFP (NL4-3) or NL4-3e-n-GFPvif-vpr- (NL4-3f-r-) (MOI = 2) in the presence or absence of indirubin (ind) or piceatannol (pic) at the μM concentration indicated in parentheses. DNA content analysis at 24 h postinfection is shown in dot plot format with GFP on the x axis as in panel A. (D) Viable cell percentages (left panel), GFP-expressing cell percentages (upper right panel), and live cell counts (bottom right panel) of samples in panel C over time for mock-infected (open symbols), NL4-3-infected (filled symbols), and NL4-3f-r--infected (half-filled symbols) cultures.
FIG. 7.
FIG. 7.
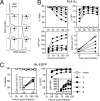
NL4-3 vif-vpr- expression and cytopathicity increases with the MOI in the absence of G2/M accumulation. Jurkat cells were mock infected (open symbol) or infected with increasing concentrations of NL4-3e-n-GFP vif-vpr- (NL4-3f-r-, filled symbols), and the DNA content and viability were measured by flow cytometry. (A) DNA content FACS histograms show cell cycle profiles at 48 h postinfection. The MOI is indicated for each sample below the corresponding symbol. (B) The percentage of viable (high forward scatter, PI-negative) cells is plotted at the indicated hours after infection (upper left panel) for the samples in panel A. Concurrent measurements of the percentage of cells expressing GFP were made (upper right panel). The GFP MFI of infected GFP+ cells determined by flow cytometry is also plotted over time (lower left panel). Live cell counts at 24 and 48 h postinfection were measured flow cytometrically by constant time acquisition (lower right panel). (C) Jurkat cells were infected with increasing concentrations of NL-EGFP (filled symbols) and viability, GFP, and cell counts were measured as in panel A. The MOI for each sample is indicated adjacent to the plot symbol on the far right.

Similar articles

Cited by

References

    1. Agostini, I., J. M. Navarro, F. Rey, M. Bouhamdan, B. Spire, R. Vigne, and J. Sire. 1996. The human immunodeficiency virus type 1 Vpr transactivator: cooperation with promoter-bound activator domains and binding to TFIIB. J. Mol. Biol. 261:599-606. - PubMed
    1. Andersen, J. L., J. L. Dehart, E. S. Zimmerman, O. Ardon, B. Kim, G. Jacquot, S. Benichou, and V. Planelles. 2006. HIV-1 Vpr-induced apoptosis is cell cycle dependent and requires Bax but not ANT. PLoS Pathog. 2:e127. - PMC - PubMed
    1. Azuma, A., A. Matsuo, T. Suzuki, T. Kurosawa, X. Zhang, and Y. Aida. 2006. Human immunodeficiency virus type 1 Vpr induces cell cycle arrest at the G1 phase and apoptosis via disruption of mitochondrial function in rodent cells. Microbes Infect. 8:670-679. - PubMed
    1. Bartz, S. R., M. E. Rogel, and M. Emerman. 1996. Human immunodeficiency virus type 1 cell cycle control: Vpr is cytostatic and mediates G2 accumulation by a mechanism which differs from DNA damage checkpoint control. J. Virol. 70:2324-2331. - PMC - PubMed
    1. Bolton, D. L., B. I. Hahn, E. A. Park, L. L. Lehnhoff, F. Hornung, and M. J. Lenardo. 2002. Death of CD4+ T-cell lines caused by human immunodeficiency virus type 1 does not depend on caspases or apoptosis. J. Virol. 76:5094-5107. - PMC - PubMed

Publication types

MeSH terms

Substances