. 2007 Aug;81(16):8552-62.
doi: 10.1128/JVI.00924-07. Epub 2007 Jun 6.

Caveolar endocytosis is critical for BK virus infection of human renal proximal tubular epithelial cells

Affiliations

Caveolar endocytosis is critical for BK virus infection of human renal proximal tubular epithelial cells

Takahito Moriyama et al. J Virol. 2007 Aug.

Abstract

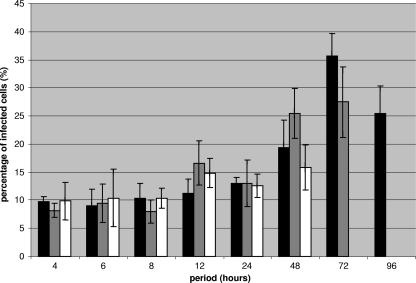
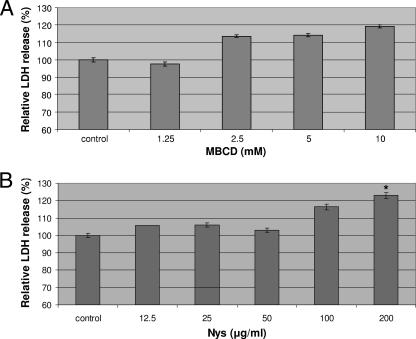
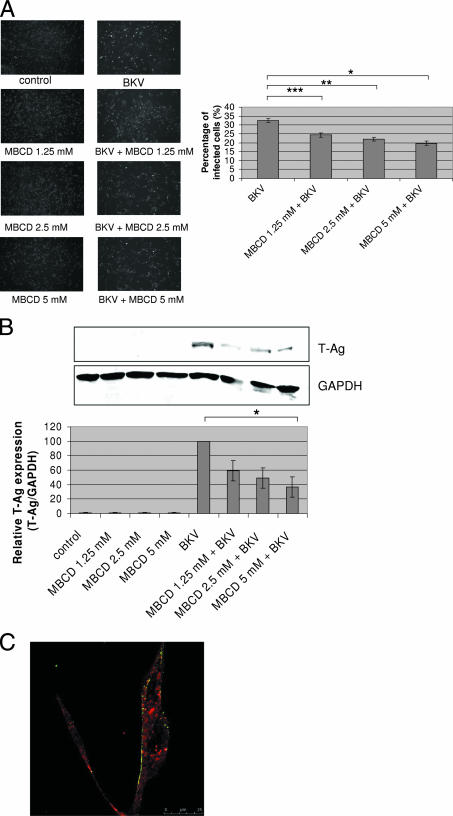
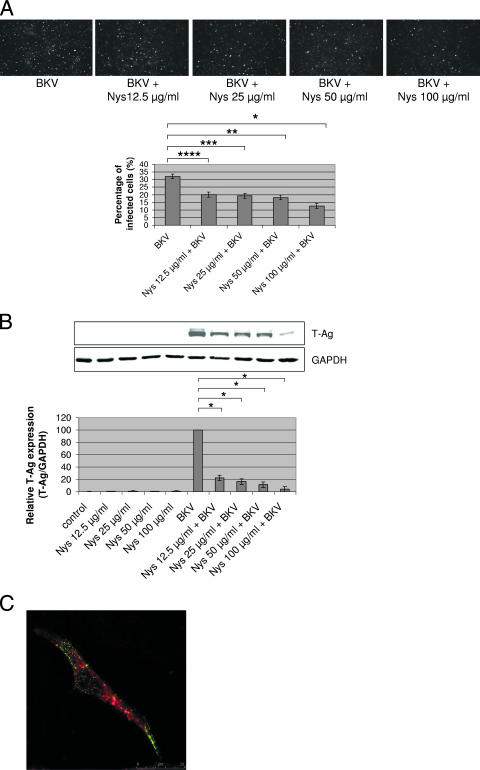
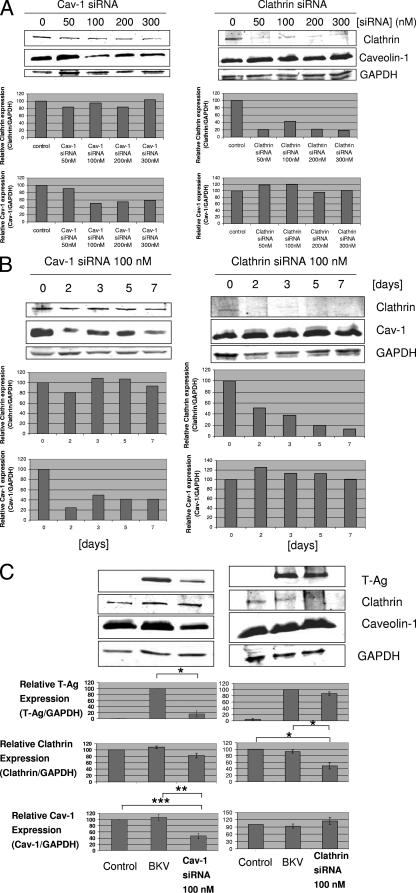
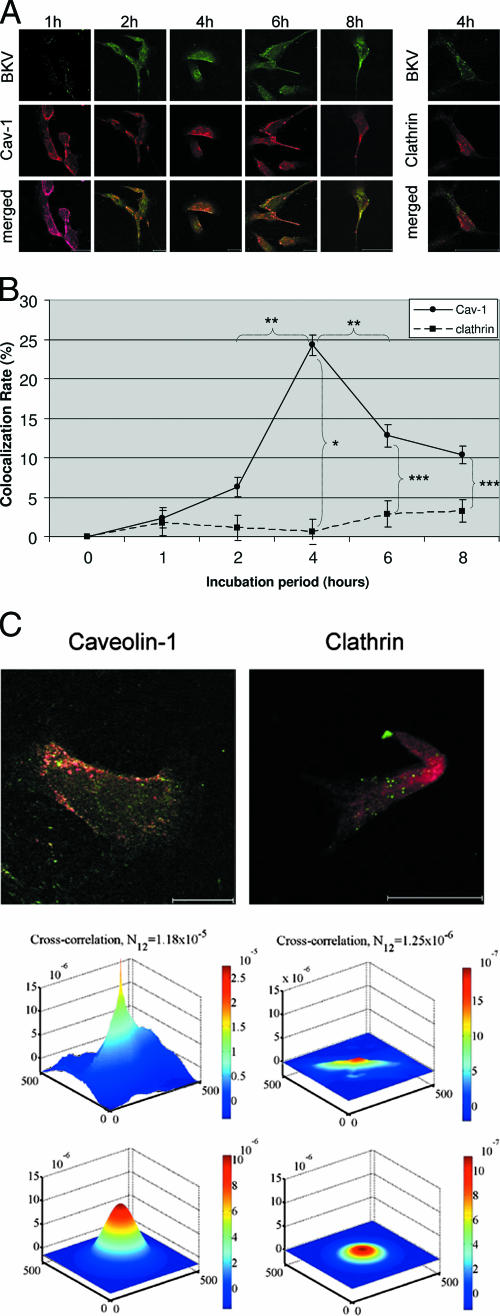
In recent years, BK virus (BKV) nephritis after renal transplantation has become a severe problem. The exact mechanisms of BKV cell entry and subsequent intracellular trafficking remain unknown. Since human renal proximal tubular epithelial cells (HRPTEC) represent a main natural target of BKV nephritis, analysis of BKV infection of HRPTEC is necessary to obtain additional insights into BKV biology and to develop novel strategies for the treatment of BKV nephritis. We coincubated HRPTEC with BKV and the cholesterol-depleting agents methyl beta cyclodextrin (MBCD) and nystatin (Nys), drugs inhibiting caveolar endocytosis. The percentage of infected cells (detected by immunofluorescence) and the cellular levels of BKV large T antigen expression (detected by Western blot analysis) were significantly decreased in both MBCD- and Nys-treated HPRTEC compared to the level in HRPTEC incubated with BKV alone. HRPTEC infection by BKV was also tested after small interfering RNA (siRNA)-dependent depletion of either the caveolar structural protein caveolin-1 (Cav-1) or clathrin, the major structural protein of clathrin-coated pits. BKV infection was inhibited in HRPTEC transfected with Cav-1 siRNA but not in HRPTEC transfected with clathrin siRNA. The colocalization of labeled BKV particles with either Cav-1 or clathrin was investigated by using fluorescent microscopy and image cross-correlation spectroscopy. The rate of colocalization of BKV with Cav-1 peaked at 4 h after incubation. Colocalization with clathrin was insignificant at all time points. These results suggest that BKV entered into HRPTEC via caveolae, not clathrin-coated pits, and that BKV is maximally associated with caveolae at 4 h after infection, prior to relocation to a different intracellular compartment.


Figures

FIG. 1.
FIG. 1.
Percentages of BKV-infected cells. HRPTEC were incubated with several doses of BKV (MOI, 0.5 to 5 FFU/cell) for different periods of time (4 to 96 h). At 48 h after this incubation period, the cells were fixed and analyzed by IF. The percentage of infected cells was calculated by the formula T-Ag-positive cells/total cells × 100. At least 500 cells were counted in each coverslip, and the means and SE were calculated from the results for three different coverslips. We could not show the result for the MOI of 0.5 FFU/cell at 96 h and the results for the MOI of 0.75 FFU/cell at the 72- and 96-h incubation periods because infected cells consistently detached from the coverslips.
FIG. 2.
FIG. 2.
Cytotoxicity assays of MBCD (A) and Nys (B). HRPTEC were incubated with MBCD (1.25, 2.5, 5, and 10 mM) and Nys (12.5, 25, 50, 100, and 200 μg/ml) for 5 days. Control, HRPTEC were not incubated with either MBCD or Nys. After incubation, supernatants and cell lysate were used for measuring the levels of LDH released. LDH was measured from five different wells for each dose. Means and SE were calculated from the results for 10 different wells from two independent examinations. *, P < 0.05.
FIG. 3.
FIG. 3.
MBCD interfered with BKV infection. HRPTEC were preincubated with MBCD (1.25, 2.5, and 5 mM) for 1 h prior to coincubation with BKV (MOI, 0.5 FFU/cell). After 72 h, medium was removed and cells were washed three times with REBM with 0.5% FBS and incubated for another 48 h with fresh medium containing MBCD. (A) After incubation, cells were fixed and analyzed by IF (magnification, ×10). T-Ag-positive cells were counted as BKV-infected cells, and the percentage was calculated against total cells. In the experiments whose results are shown in Fig. 3 and 4, untreated HRPTEC and HRPTEC incubated with BKV only were used as negative and positive controls. At least 500 cells were counted from three independent coverslips, and means and SE were calculated from the results of two independent experiments. *, P < 0.02; **, P < 0.01; ***, P < 0.005. (B) After incubation, cells were harvested and analyzed by WB. Relative levels of T-Ag expression were detected by using an Odyssey system to measure the intensities and depicted as graph bars. The intensity of T-Ag expression was corrected by the intensity of GAPDH as the loading control. Means and SE were calculated from the results of two independent experiments. Control, HRPTEC were not incubated with either BKV or MBCD; *, P < 0.05. (C) HRPTEC were preincubated with 5 mM of MBCD for 1 h prior to an 8-h coincubation with labeled BKV (MOI, 5 FFU/cell) and transferrin, (10.0 μg/ml). After cells were fixed, Alexa Fluor 488-labeled BKV (green) and Alexa Fluor 633-conjugated transferrin (red) were observed by confocal microscope using a 63× lens objective.
FIG. 4.
FIG. 4.
Nys interfered with BKV infection. HRPTEC were preincubated with Nys (12.5, 25, 50, and 100 μg/ml) for 1 h prior to coincubation with BKV (MOI, 0.5 FFU/cell) and Nys for 72 h. The medium was removed, and cells were washed three times with REBM with 0.5% FBS and incubated for another 48 h with fresh medium containing Nys. (A) After incubation, cells were fixed and analyzed by IF (magnification, ×10). T-Ag-positive cells were counted as BKV-infected cells, and the percentage was calculated against total cells. At least 500 cells were counted from three independent coverslips, and means and SE were calculated from two independent experiments. *, P < 0.01; **, P < 0.005; ***, P < 0.005; ****, P < 0.002. (B) After incubation, cells were harvested and analyzed by WB. Relative levels of T-Ag expression were detected by measuring the intensities with an Odyssey system and depicted as graph bars. The intensity of T-Ag expression was corrected by the intensity of GAPDH as the loading control. Means and SE were calculated from the results of two independent experiments. Control, HRPTEC were not incubated with either BKV or Nys; *, P < 0.001. (C) HRPTEC were preincubated with 100 μg/ml of Nys for 1 h prior to 8 h of coincubation with labeled BKV (MOI, 5 FFU/cell) and transferrin (10.0 μg/ml). After cells were fixed, Alexa Fluor 488-labeled BKV (green) and Alexa Fluor 633-conjugated transferrin (red) were observed by confocal microscope using a 63× lens objective.
FIG. 5.
FIG. 5.
Cav-1 siRNA decreased BKV infection of HRPTEC, whereas clathrin siRNA was ineffective. Levels of Cav-1 and clathrin expression were analyzed by WB. Relative T-Ag, Cav-1, and clathrin expression levels were calculated as the ratio between the intensities of the T-Ag, Cav-1, or clathrin bands and the GAPDH band (equal loading control) measured by using the Odyssey system, and the results were presented as graph bars. Means and SE were calculated from the results of at least two independent experiments. *, P < 0.01; **, P < 0.03; ***, P < 0.05. (A) Dose dependence of siRNA transfection. HRPTEC were transfected with 50 to 300 nM of either Cav-1 siRNA or clathrin siRNA. At 48 h after transfection, cells were harvested and analyzed by WB. (B) Time course of 100 nM and 200 nM Cav-1 siRNA transfection. HRPTEC were transfected with 100 nM Cav-1 and clathrin siRNA. Cells were harvested at 2, 3, 5, and 7 days after transfection and analyzed by WB. (C) Cav-1 siRNA transfection interfered with BKV infection. HRPTEC were transfected with 100 nM either of Cav-1 or clathrin siRNA. HRPTEC were incubated with BKV at 2 days after administration of Cav-1 or clathrin siRNA, fresh medium was added 5 days after siRNA transfection, and cells were harvested 7 days after transfection. Control, HRPTEC neither incubated with BKV nor transfected with siRNA. BKV, HRPTEC incubated with BKV but not transfected with siRNA.
FIG. 6.
FIG. 6.
Colocalization of labeled BKV with Cav-1 or clathrin. (A) Colocalization of BKV with Cav-1 or clathrin. HRPTEC were incubated with Alexa Fluor 488-labeled BKV (green) for 0 to 8 h. After incubation, cells were fixed, immunofluoresced for anti-Cav-1 antibody (red) or anti-clathrin antibody (red), and analyzed by confocal microscope using a 63× lens objective. Bars represent 25 μm. Labeled BKV particles colocalized with Cav-1 or clathrin were expressed as yellow pixels in merged image. (B) Time course and quantitative analysis of colocalization. Colocalization rates of labeled BKV with Cav-1 and clathrin were calculated from the results for at least 100 cells randomly selected from three independent experiments and evaluated from each incubation period. The colocalization threshold and viral particle threshold were determined automatically and regularly by finding the higher intensity value for yellow pixels and green pixels. Means and SE were calculated from the results of at least two independent experiments. *, P < 0.001; **, P < 0.01; ***, P < 0.05. (C) Image cross-correlation analysis. Colocalization of viral particles (Alexa Fluor 488, green) with their potential fusion protein partner of endocytosis, caveolin or clathrin (Alexa Fluor 680, red), was analyzed. The peak height of cross correlation data indicating the degree of cross-correlation in green pixels with the red pixels of caveolin (upper left graph) was much higher than that of clathrin (upper right graph). Fitting the raw data with an analytical correlation function allowed the quantitative estimation of the degree of cross correlation (N12) (lower left graph for caveolin and lower right graph for clathrin). Overlap of excitation signal between the two dyes was negligible.

Similar articles

Cited by

References

    1. Abend, J. R., J. A. Low, and M. J. Imperiale. 2006. Inhibitory effect of gamma interferon on BK virus gene expression and replication. J. Virol. 81:272-279. - PMC - PubMed
    1. Allen, M. J., and N. Rushton. 1994. Use of the CytoTox 96 assay in routine biocompatibility testing in vitro. Promega Notes 45:7-10.
    1. Celik, B., and P. S. Randhawa. 2004. Glomerular change in BK virus nephropathy. Hum. Pathol. 35:367-370. - PubMed
    1. Chen, Y., and L. C. Norkin. 1999. Extracellular simian virus 40 transmits a signal that promotes virus enclosure within caveolae. Exp. Cell Res. 246:83-90. - PubMed
    1. Damm, E. M., L. Pelkmans, J. Kartenbeck, A. Mezzacasa, T. Kurzchalia, and A. Helenius. 2005. Clathrin- and caveolin-1-independent endocytosis: entry of simian virus 40 into cells devoid of caveolae. J. Cell Biol. 168:477-488. - PMC - PubMed

Publication types

MeSH terms

LinkOut - more resources