

Transformation of temporal properties between auditory midbrain and cortex in the awake Mongolian gerbil
- PMID: 17553982
- PMCID: PMC6672143
- DOI: 10.1523/JNEUROSCI.4848-06.2007
Transformation of temporal properties between auditory midbrain and cortex in the awake Mongolian gerbil
Abstract
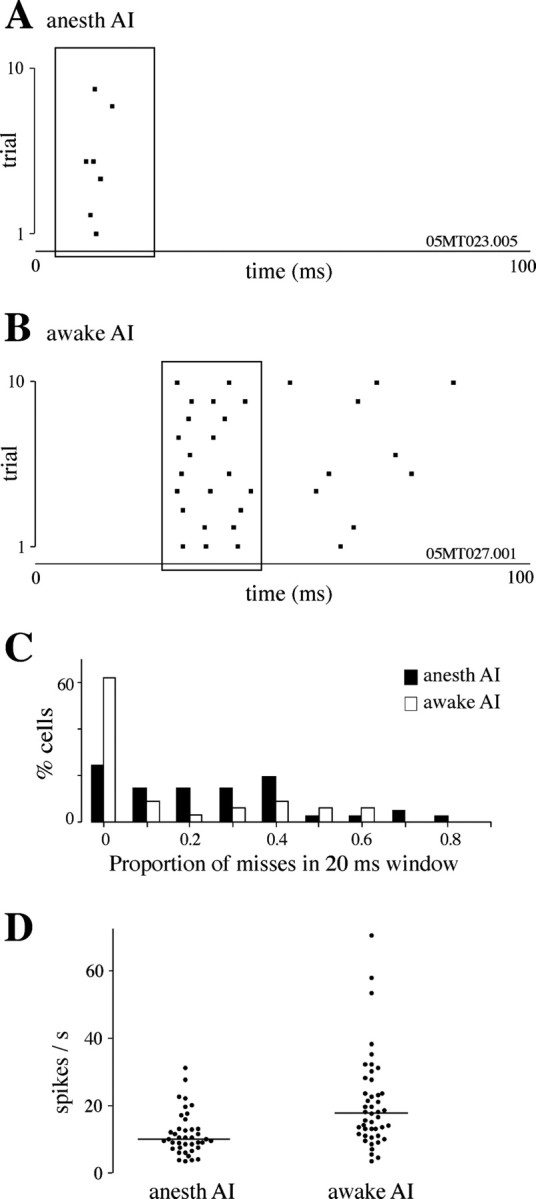
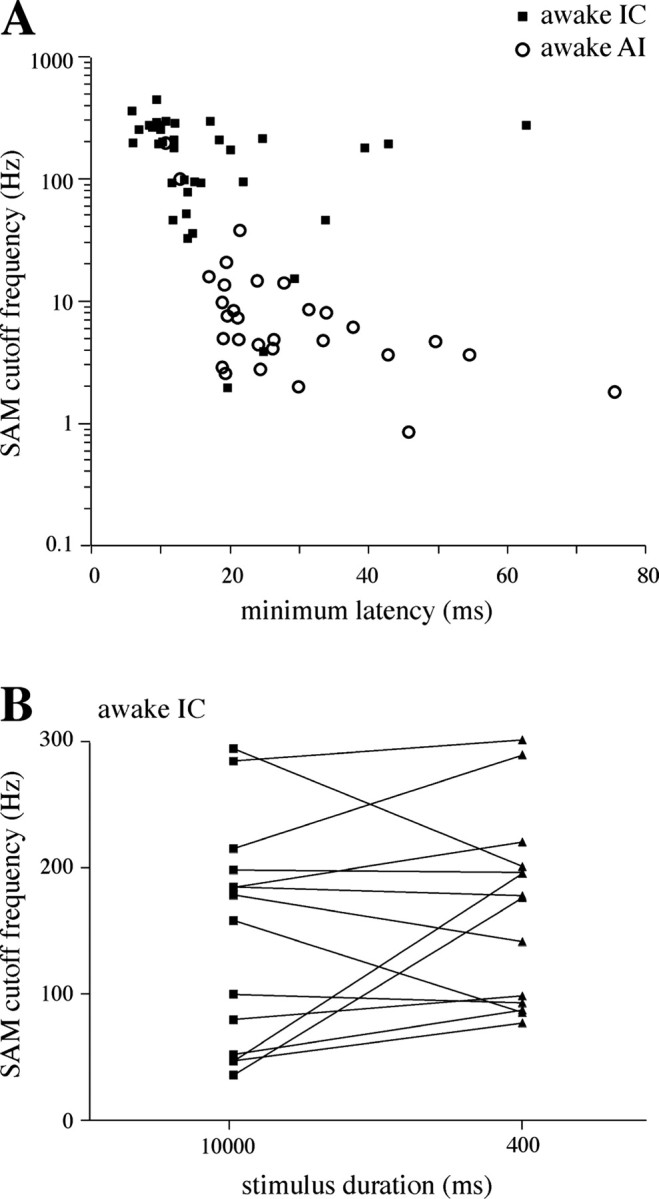
The neural representation of meaningful stimulus features is thought to rely on precise discharge characteristics of the auditory cortex. Precisely timed onset spikes putatively carry the majority of stimulus-related information in auditory cortical neurons but make a small contribution to stimulus representation in the auditory midbrain. Because these conclusions derive primarily from anesthetized preparations, we reexamined temporal coding properties of single neurons in the awake gerbil inferior colliculus (IC) and compared them with primary auditory cortex (AI). Surprisingly, AI neurons displayed a reduction of temporal precision compared with those in the IC. Furthermore, this hierarchical transition from high to low temporal fidelity was observed for both static and dynamic stimuli. Because most of the data that support temporal precision were obtained under anesthesia, we also reexamined response properties of IC and AI neurons under these conditions. Our results show that anesthesia has profound effects on the trial-to-trial variability and reliability of discharge and significantly improves the temporal precision of AI neurons to both tones and amplitude-modulated stimuli. In contrast, IC temporal properties are only mildly affected by anesthesia. These results underscore the pitfalls of using anesthetized preparations to study temporal coding. Our findings in awake animals reveal that AI neurons combine faster adaptation kinetics and a longer temporal window than evident in IC to represent ongoing acoustic stimuli.
Figures


Similar articles
-
Coding of electric pulse trains presented through cochlear implants in the auditory midbrain of awake rabbit: comparison with anesthetized preparations.J Neurosci. 2014 Jan 1;34(1):218-31. doi: 10.1523/JNEUROSCI.2084-13.2014. J Neurosci. 2014. PMID: 24381283 Free PMC article.
-
A spike-timing code for discriminating conspecific vocalizations in the thalamocortical system of anesthetized and awake guinea pigs.J Neurosci. 2009 Jan 14;29(2):334-50. doi: 10.1523/JNEUROSCI.3269-08.2009. J Neurosci. 2009. PMID: 19144834 Free PMC article.
-
Auditory temporal processing: responses to sinusoidally amplitude-modulated tones in the inferior colliculus.J Neurophysiol. 2000 Jul;84(1):255-73. doi: 10.1152/jn.2000.84.1.255. J Neurophysiol. 2000. PMID: 10899201
-
Corticofugal modulation of temporal and rate representations in the inferior colliculus of the awake marmoset.Cereb Cortex. 2022 Sep 4;32(18):4080-4097. doi: 10.1093/cercor/bhab467. Cereb Cortex. 2022. PMID: 35029654
-
Reliability and representational bandwidth in the auditory cortex.Neuron. 2005 Nov 3;48(3):479-88. doi: 10.1016/j.neuron.2005.10.016. Neuron. 2005. PMID: 16269364 Review.
Cited by
-
Spatial cue reliability drives frequency tuning in the barn Owl's midbrain.Elife. 2014 Dec 22;3:e04854. doi: 10.7554/eLife.04854. Elife. 2014. PMID: 25531067 Free PMC article.
-
Directional hearing by linear summation of binaural inputs at the medial superior olive.Neuron. 2013 Jun 5;78(5):936-48. doi: 10.1016/j.neuron.2013.04.028. Neuron. 2013. PMID: 23764292 Free PMC article.
-
A Decline in Response Variability Improves Neural Signal Detection during Auditory Task Performance.J Neurosci. 2016 Oct 26;36(43):11097-11106. doi: 10.1523/JNEUROSCI.1302-16.2016. J Neurosci. 2016. PMID: 27798189 Free PMC article.
-
Emergence of an Adaptive Command for Orienting Behavior in Premotor Brainstem Neurons of Barn Owls.J Neurosci. 2018 Aug 15;38(33):7270-7279. doi: 10.1523/JNEUROSCI.0947-18.2018. Epub 2018 Jul 16. J Neurosci. 2018. PMID: 30012694 Free PMC article.
-
Gradients of response latencies and temporal precision of auditory neurons extend across the whole inferior colliculus.J Neurophysiol. 2023 Sep 1;130(3):719-735. doi: 10.1152/jn.00461.2022. Epub 2023 Aug 23. J Neurophysiol. 2023. PMID: 37609690 Free PMC article.
References
-
- Astl J, Popelar J, Kvasnak E, Syka J. Comparison of response properties of neurons in the inferior colliculus of guinea pigs under different anesthetics. Audiology. 1996;35:335–345. - PubMed
-
- Batra R, Kuwada S, Stanford TR. Temporal coding of envelopes and their interaural delays in the inferior colliculus of the unanesthetized rabbit. J Neurophysiol. 1989;61:257–268. - PubMed
-
- Chimoto S, Kitama T, Qin L, Sakayori S, Sato Y. Tonal response patterns of primary auditory cortex neurons in alert cats. Brain Res. 2002;934:34–42. - PubMed
Publication types
MeSH terms
Grants and funding
LinkOut - more resources
Full Text Sources
Other Literature Sources