Comparative Study
. 2007 Jun 6;27(23):6185-96.
doi: 10.1523/JNEUROSCI.0628-07.2007.

A crucial role for p57(Kip2) in the intracellular timer that controls oligodendrocyte differentiation

Affiliations
Comparative Study

A crucial role for p57(Kip2) in the intracellular timer that controls oligodendrocyte differentiation

Jason C Dugas et al. J Neurosci. .

Abstract

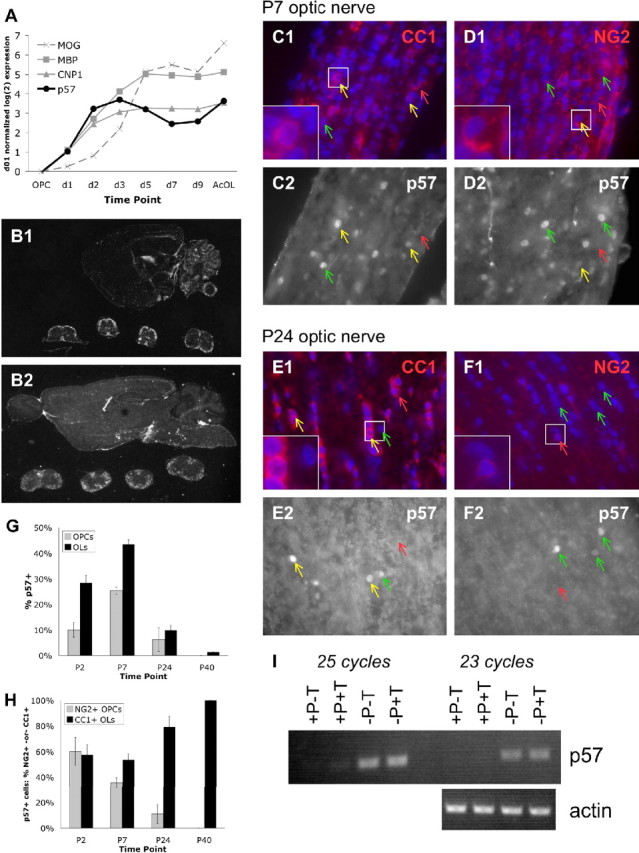
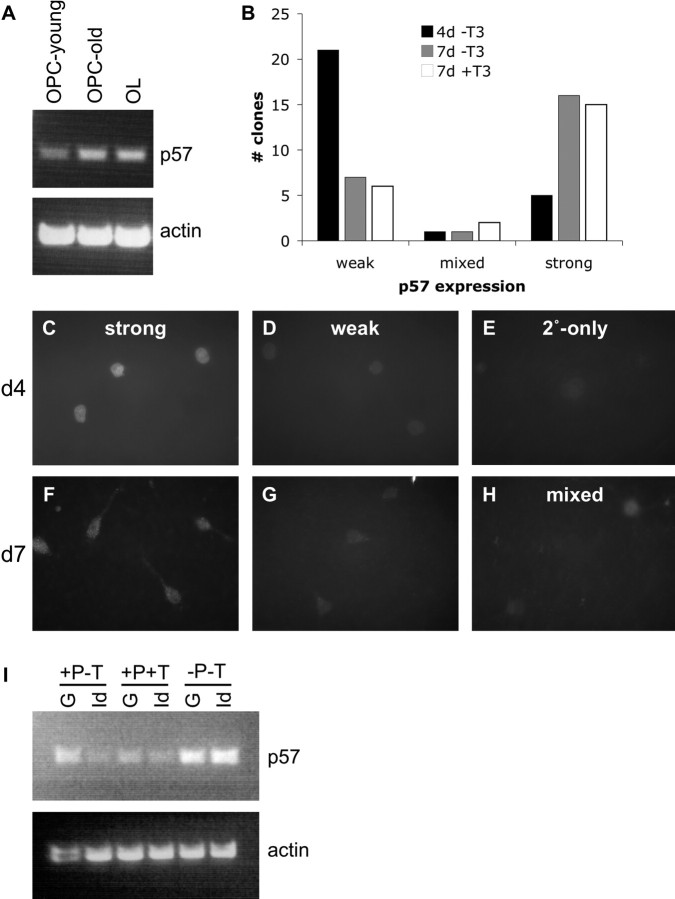
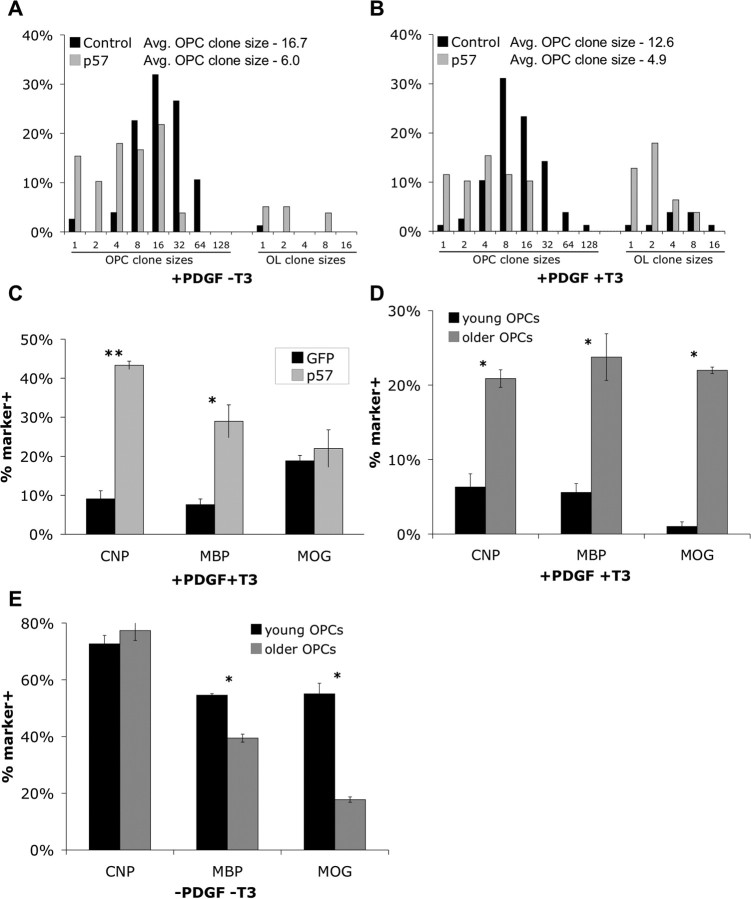
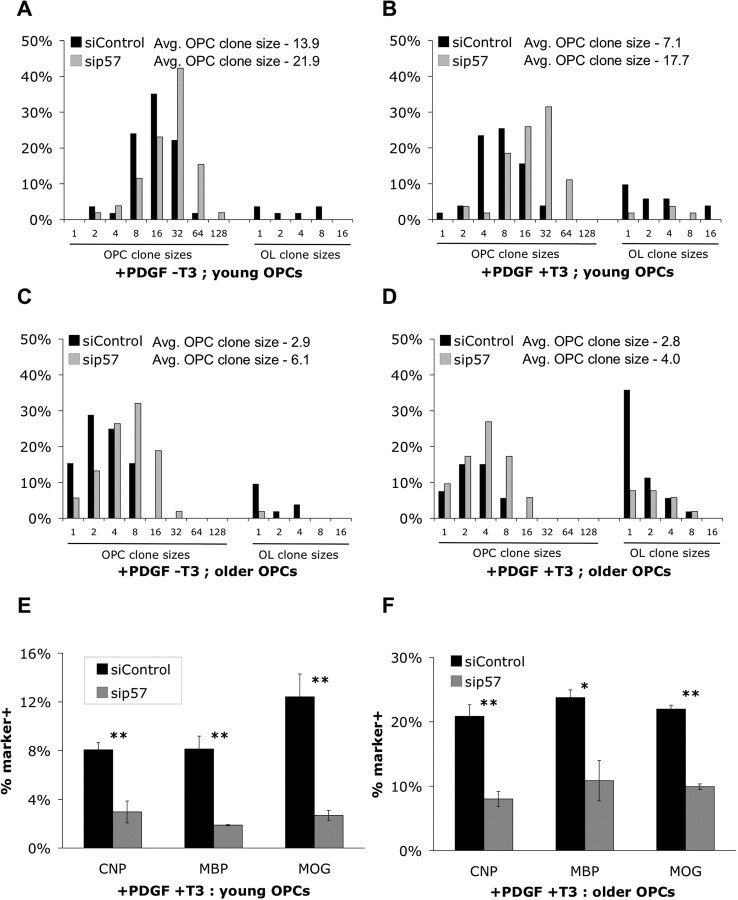
The intracellular molecular mechanism that controls the timing of oligodendrocyte differentiation remains unknown. Temple and Raff (1986) previously showed that an oligodendrocyte precursor cell (OPC) can divide a maximum of approximately eight times before its daughter cells simultaneously cease proliferating and differentiate into oligodendrocytes. They postulated that over time the level of an intracellular molecule might synchronously change in each daughter cell, ultimately reaching a level that prohibited additional proliferation. Here, we report the discovery of such a molecule, the cyclin-dependent kinase inhibitor p57(Kip2) (Cdkn1c). We show in vitro that all daughters of a clone of OPCs express similar levels of p57(Kip2), that p57(Kip2) levels increase over time in proliferating OPCs, and that p57(Kip2) levels regulate how many times an OPC can divide before differentiating. These findings reveal a novel part of the mechanism by which OPCs measure time and are likely to extend to similar timers in many other precursor cell types.


Figures

Figure 1.
Figure 1.
Regulation of p57Kip2 expression. p57Kip2 is expressed in differentiating OLs. A, p57Kip2 is induced in differentiating OLs in vitro. Expression levels of p57Kip2 (black circles, rc_AA998565_at probe set), early induced myelin genes CNP (gray triangles, L16532_at) and MBP (gray squares, average K00512_at, rc_AI044093_at, rc_AI145512_at), and late induced myelin gene MOG (gray dashed X, M99485_at) as assayed on Affymetrix U34A-C gene chips (Dugas et al., 2006). OPC, Purified OPCs; d1–d9, days after induction of OL differentiation in vitro by mitogen withdrawal and T3 exposure; AcOL, acutely purified P12 OLs. All expression values are normalized to OPC expression level and expressed on a log2 scale. B, In situ expression of p57Kip2 in sagittal sections of P7 (B1) and P42 (B2) mouse brain, obtained from St. Jude's BGEM website (www.stjudebgem.org). C–F, Immunostaining of P7 (C, D) and P24 (E, F) optic nerve sections. Sections were costained for CC-1 (red) and p57Kip2 (white) expression (C, E) or NG2 (red) and p57Kip2 (white) expression (D, F). Blue, DAPI nuclear stain. Green arrows indicate cells expressing only p57Kip2; red arrows indicate cells only expressing CC-1 (C, E) or NG2 (D, F); and yellow arrows indicate cells coexpressing p57Kip2 and either CC-1 or NG2. White boxes indicate regions of higher magnification shown in the lower left corners of C1–F1. G, Proportion of NG2+ OPCs (gray bars) and CC-1+ OLs (black bars) that were positive for p57Kip2 expression in the optic nerve at various developmental ages, as assayed by immunostaining. H, Proportion of p57Kip2-positive cells that were NG2+ OPCs (gray bars) or CC-1+ OLs (black bars) in the optic nerve at various developmental ages. At P2, the >100% sum of NG2+ and CC-1+ cells may reflect the presence of a small population of cells that coexpress NG2 and CC-1. In G and H, for each age-staining (p57Kip2 + NG2 and p57Kip2 + CC-1), >100 cells were scored from two distinct optic nerves, except P24-NG2 and P40-NG2 (48 and 23 cells, respectively) because of paucity of NG2+ and p57Kip2+ cells at those ages. All data presented are ± SE of the proportion. I, RT-PCR to assay p57Kip2 (23 and 25 cycles) and β-actin (control, 23 cycles) expression levels in purified P8 OPCs incubated for 6 DIV in medium containing or lacking PDGF/NT3 (± P), containing or lacking T3 (± T).
Figure 2.
Figure 2.
Regulation of p57Kip2 expression in proliferating OPCs. A, RT-PCR (25 cycles) to detect p57Kip2 or β-actin expression in purified OPCs cultured for 7 DIV (OPC-young) or 28 DIV (OPC-old) in +PDGF -T3 medium or for 4 DIV in -PDGF +T3 medium (OL). B, Quantification of clones uniformly expressing a low level of p57Kip2 (weak), uniformly expressing a high level of p57Kip2 (strong), or showing mixed levels of p57Kip2 expression (mixed) as assayed by immunostaining after 4 DIV in +PDGF -T3 medium (black bars), 7 DIV in +PDGF -T3 medium (gray bars), or 7 DIV in +PDGF +T3 medium (white bars). Clones containing less than two healthy cells were not counted; >20 clones scored/condition. C–H, Generally uniform expression of p57Kip2 in clones of OPCs. OPCs cultured for 7 DIV in +PDGF -T3 medium and then plated at clonal density and cultured for 4 DIV (C–E) or 7 DIV (F–H) in +PDGF -T3 medium were immunostained for p57Kip2 expression (C, D, F–H ) or only stained with secondary antibody (E); pictures of representative cells from within larger clones are shown (8 to >50 cells/clone). C, F, Cells from clones uniformly expressing a high level of p57Kip2. D, G, Cells from clones uniformly expressing a lower level of p57Kip2. H, Cells from the one mixed intensity p57Kip2 clone observed at 7 DIV in +PDGF -T3 (weaker expression bottom left). I, RT-PCR (26 cycles) to detect p57Kip2 or β-actin expression in purified OPCs transfected with a CMV-GFP vector (G) or a CMV-Id4 vector (Id) and then cultured for 3 DIV in -PDGF -T3 medium or 6 DIV in +PDGF ±T3 medium.
Figure 3.
Figure 3.
Increasing p57Kip2 slows OPC proliferation and accelerates OPC responsiveness to T3. A, B, Purified OPCs transfected with a CMV-GFP vector alone (black bars) or CMV-GFP plus CMV-p57Kip2 vectors (gray bars) and then plated at clonal density (250 cells/well) and cultured for 4 DIV in PDGF/NT3 containing medium without (A) or with (B) added T3 (+PDGF ±T3). Only clones containing GFP+ cells were scored. Clones containing ≥50% morphologically complex OL-like cells were scored as OL clones, <50% morphologically complex cells were scored as OPC clones, and both OPC and OL clone sizes were binned and plotted as histograms (1, 2, 3–4, 5–8 cells, etc.). In each condition, >70 clones were scored. In both A and B, OPC clone sizes are significantly decreased by p57Kip2 overexpression (p < 0.0001; Student's t test). C–E, In each experiment, the proportions of transfected (GFP+) cells expressing CNP, MBP, or MOG were determined by immunostaining after culturing as described (±SEM; n = 3 each condition). C, Purified OPCs transfected with CMV-GFP (black bars) or CMV-GFP + CMV-p57Kip2 (gray bars) were cultured for 7 DIV in +PDGF +T3 medium before immunostaining (*p < 0.01; **p < 0.001; Student's t test). D, E, Purified OPCs initially cultured for 7 DIV (black bars) or 28 DIV (gray bars) in +PDGF -T3 medium were transfected with CMV-GFP and nontargeting siRNA and cultured for either an additional 7 DIV in +PDGF +T3 medium before immunostaining (p < 0.006; Student's t test) (D) or an additional 3 (CNP, MBP) or 4 (MOG) DIV in -PDGF -T3 medium before immunostaining (*p < 0.001; Student's t test) (E).
Figure 4.
Figure 4.
Decreasing p57Kip2 expression accelerates OPC proliferation and decreases OPC responsiveness to T3. A–D, OPCs initially cultured for 7 DIV (A, B) or 28 DIV (C, D) in +PDGF -T3 medium were transfected with a CMV-GFP vector plus nontargeting siRNA (black bars) or siRNA targeting p57Kip2 (gray bars) and then plated at clonal density (A, B, 250 cells/well; C, D, 500 cells/well) and cultured for 4 DIV in PDGF/NT3 containing medium without (A, C) or with (B, D) added T3 (+PDGF ±T3). Only clones containing GFP+ cells were scored. Clones containing ≥50% morphologically complex OL-like cells were scored as OL clones, <50% morphologically complex cells were scored as “OPC clones,” and both OPC and OL clone sizes were binned and plotted as histograms. In each condition, >50 clones were scored. In A–D, OPC clone sizes are significantly increased by p57Kip2 knockdown (A, p < 0.005; B, p < 0.0001; C, p < 0.0001; D, p < 0.05; Student's t test). E, F, Purified OPCs initially cultured for 7 DIV (E) or 28 DIV (F) in +PDGF -T3 medium were transfected as described in A–D and then cultured for an additional 7 d in +PDGF +T3 medium. The proportions of transfected (GFP+) cells expressing CNP, MBP, or MOG were subsequently determined by immunostaining (±SEM; n = 3 each condition; *p < 0.05, **p < 0.01, Student's t test).
Figure 5.
Figure 5.
Reducing p57Kip2 expression retards OPC response to mitogen withdrawal. A–D, Purified OPCs cotransfected with a CMV-GFP vector and either siRNA targeting p57Kip2 (sip57; B, D) or control nontargeting siRNA (siControl; A, C) were plated in -PDGF -T3 medium for 3 DIV and stained for MBP (red) and GFP (white) expression (A, B), or 4 DIV and stained for MOG (red) and GFP (white) expression (C, D). Blue, DAPI nuclear stain. Yellow arrows indicate transfected cells (GFP+) expressing MBP (A, B) or MOG (C, D), green arrows indicate transfected cells not expressing MBP or MOG, and red arrows indicate untransfected cells (GFP-) expressing MBP or MOG. E, Proportion of siControl (green bars), sip57 (red bars), sip27 (blue bars) transfected, or sip57 + sip27 cotransfected (yellow bars) cells expressing CNP, MBP, or MOG after 3 DIV (CNP, MBP) or 4 DIV (MOG) in -PDGF -T3 medium (±SEM; n = 3 each condition; *p < 0.01, Holm–Sidak post hoc test vs control). All sip57, sip27, and sip57+sip27 cotransfections not significantly different from each other except: CNP, sip57 versus sip27 and sip27+sip57; MBP, sip27+sip57 versus sip57 and sip27; MOG, sip27+sip57 versus sip57 and sip27 (all exceptions listed; p < 0.01; Holm–Sidak; all pairwise post hoc test).
Figure 6.
Figure 6.
Increasing p57Kip2 and ZFP536 expression promotes OL differentiation. Increasing p57Kip2 expression initiates OL differentiation, and p57Kip2 + ZFP536 together cooperatively enhance late-stage OL differentiation in the absence of differentiation-promoting stimuli. A–H, Purified OPCs transfected with a CMV-GFP vector (GFP only; A, E), or cotransfected with CMV-GFP + CMV-p57Kip2 (p57; B, F), + CMV-ZFP536 (ZFP536; C, G), or both CMV-p57Kip2 + CMV-ZFP536 (p57+ZFP536; D, H) were cultured for 7 DIV in +PDGF -T3 medium. Cells were then costained for MBP (red) and GFP (white) expression (A–D) or MOG (red) and GFP (white) expression (E–H). Blue, DAPI nuclear stain. Yellow arrows indicate transfected cells (GFP+) expressing MBP (A–D) or MOG (E–H), green arrows indicate transfected cells not expressing MBP or MOG. I, Proportion of control (green bars), p57Kip2 (red bars), ZFP536 (blue bars), or p57Kip2 + ZFP536 (yellow bars) transfected cells expressing CNP, MBP, or MOG after 7 DIV in +PDGF -T3 medium (±SEM; n = 6 all conditions except CNP–both condition, n = 3; *p < 0.05, **p < 0.01 vs control Holm–Sidak post hoc test; in all cases, control vs ZFP536, p > 0.05 and p57 vs both, p > 0.05, except ## p < 0.01 Holm–Sidak post hoc test).
Figure 7.
Figure 7.
Model for the role of p57Kip2 in OL differentiation. A, In the presence of mitogens and the absence of T3 early in development, p57Kip2 levels are kept low in part by inhibition of E47 by Id4. Low levels of cell cycle inhibitor proteins (e.g., p57, p27, p18) result in disinhibition of CyclinE-cdk2 and CyclinD-cdk4/6 complexes and progression of the cell cycle. B, When mitogens become limiting (e.g., PDGF; -P), p57Kip2 expression is rapidly induced, likely partially (but not wholly) via reduced Id4 levels, resulting in disinhibition of E47 and increase in p57Kip2 production. Mitogen withdrawal also promotes an increase in p27Kip1 levels and a decrease in CyclinD levels, cumulatively leading to the inhibition of CyclinE-cdk2 and CyclinD-cdk4/6 complexes and promotion of cell cycle arrest. C, When exposed to T3 (T3), p18Ink4c and p27Kip1 proteins are induced, leading to a reduction in Cyclin-cdk complex activity. In older OPCs, Id4 levels are reduced via an unknown mechanism independent of T3 activity (time). The resulting activation of E47 leads to an increase in p57Kip2 which, coupled with the actions of T3, promotes cell cycle arrest in older OPCs. Both p57Kip2and T3 may also promote OL differentiation via more direct stimulation of OL gene transcription.

References

    1. Baas D, Bourbeau D, Sarlieve LL, Ittel ME, Dussault JH, Puymirat J. Oligodendrocyte maturation and progenitor cell proliferation are independently regulated by thyroid hormone. Glia. 1997;19:324–332. - PubMed
    1. Balint E, Phillips AC, Kozlov S, Stewart CL, Vousden KH. Induction of p57(KIP2) expression by p73beta. Proc Natl Acad Sci USA. 2002;99:3529–3534. - PMC - PubMed
    1. Barres BA, Raff MC. Control of oligodendrocyte number in the developing rat optic nerve. Neuron. 1994;12:935–942. - PubMed
    1. Barres BA, Hart IK, Coles HS, Burne JF, Voyvodic JT, Richardson WD, Raff MC. Cell death and control of cell survival in the oligodendrocyte lineage. Cell. 1992;70:31–46. - PubMed
    1. Barres BA, Schmid R, Sendnter M, Raff MC. Multiple extracellular signals are required for long-term oligodendrocyte survival. Development. 1993;118:283–295. - PubMed

Publication types

Substances

LinkOut - more resources