Comparative Study
. 2007 Jun 6;27(23):6197-206.
doi: 10.1523/JNEUROSCI.1833-07.2007.

The relation of brain oscillations to attentional networks

Affiliations
Comparative Study

The relation of brain oscillations to attentional networks

Jin Fan et al. J Neurosci. .

Abstract

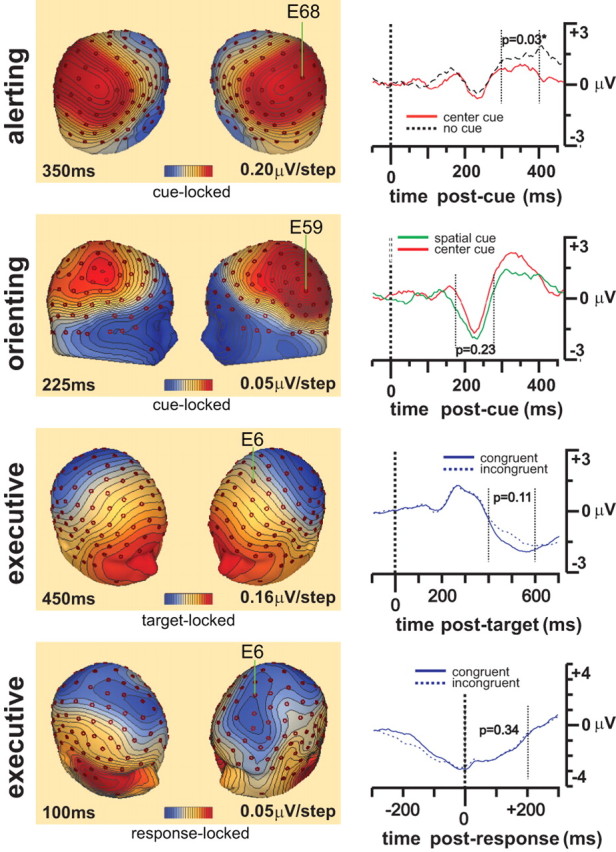
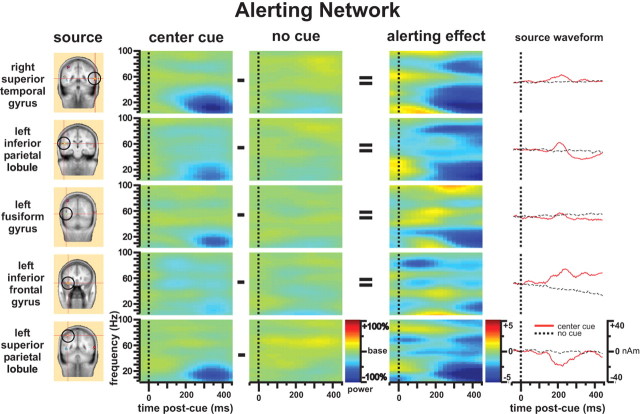
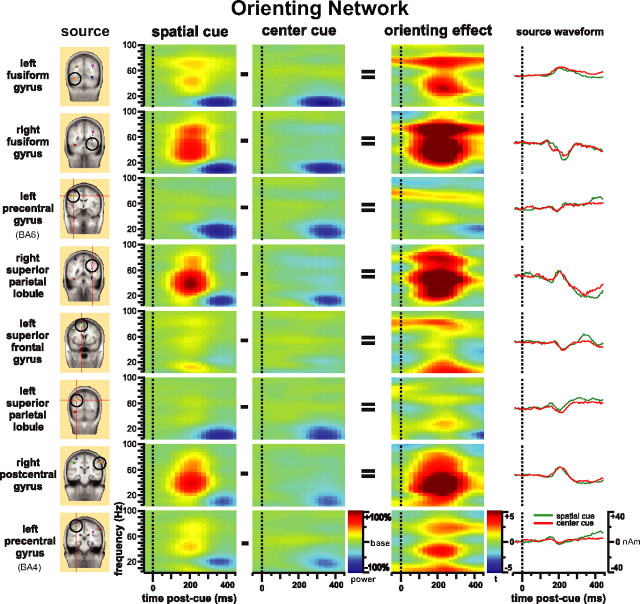
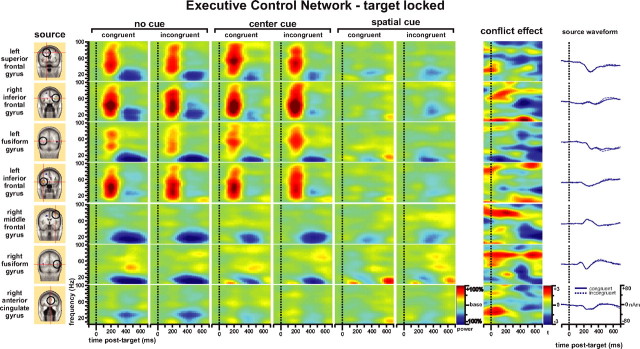
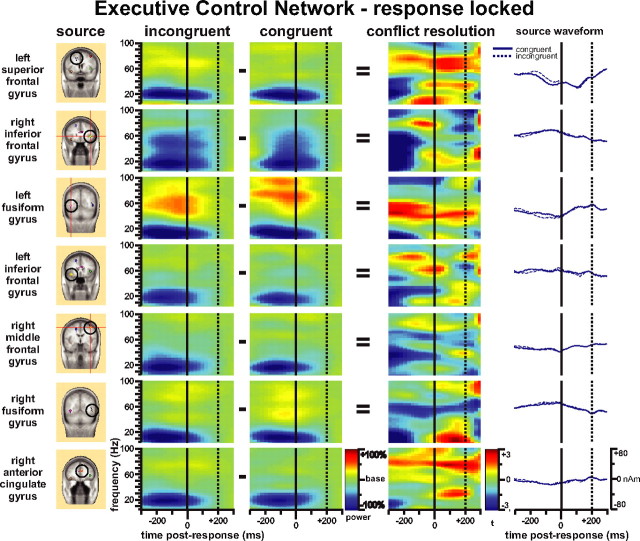
Previous studies have suggested the relation of particular frequency bands such as theta (4-8 Hz), alpha (8-14 Hz), beta (14-30 Hz), or gamma (>30 Hz) to cognitive functions. However, there has been controversy over which bands are specifically related to attention. We used the attention network test to separate three anatomically defined brain networks that carry out the functions of alerting, orienting, and executive control of attention. High-density scalp electrical recording was performed to record synchronous oscillatory activity and power spectrum analyses based on functional magnetic resonance imaging constrained dipole modeling were conducted for each attentional network. We found that each attentional network has a distinct set of oscillations related to its activity. The alerting network showed a specific decrease in theta-, alpha-, and beta-band activity 200-450 ms after a warning signal. The orienting network showed an increase in gamma-band activity at approximately 200 ms after a spatial cue, indicating the location of a target. The executive control network revealed a complex pattern when a target was surrounded with incongruent flankers compared with congruent flankers. There was an early (<400 ms) increase in gamma-band activity, a later (>400 ms) decrease in beta- and low gamma-band activity after the target onset, and a decrease of all frequency bands before response followed by an increase after the response. These data demonstrate that attention is not related to any single frequency band but that each network has a distinct oscillatory activity and time course.


Figures

Figure 1.
Figure 1.
Schematic of the ANT. A fixation cross appears in the center of the screen all of the time. In each trial, depending on the cue condition (no cue, center cue, or spatial cue), a cue may appear for 200 ms. After a variable duration (300–1450 ms), the target (the center arrow) and flankers of two left and two right arrows (congruent or incongruent flankers) are presented. The participant makes a response to the target's direction within a time window of 2000 ms. The target and flankers disappear after the response is made. The target and post-target fixation period lasts for a variable duration (3000–4200 ms).
Figure 2.
Figure 2.
A, B, The behavioral results of RT (A) and accuracy (B) as factors of cue and target conditions.
Figure 3.
Figure 3.
The voltage scalp distribution maps for alerting at 350 ms, orienting at 225 ms, and both target- and response-locked conflict effects at 450 and 100 ms respectively. Left, Voltage scalp distribution maps; right, stimulus-locked waveform from averaged channels centered at E68 for alerting, E59 for orienting, and E6 for target- and response-locked executive control effects are displayed for comparison.
Figure 4.
Figure 4.
Time-frequency pattern of the alerting network. The source column shows the dipole sources used for the dipole modeling of the alerting network. The center cue and no cue columns are the power change (percentage) after onset of center cue and no cue compared with baseline. The alerting effect column represents the alerting effect as the difference of the center cue column minus the no cue column shown with t maps.
Figure 5.
Figure 5.
Time-frequency pattern of the orienting network. The source column shows the dipole sources used for the dipole modeling of the orienting network. The spatial cue and center cue columns are the power change (percentage) after onset of spatial cue and center cue compared with baseline. The orienting-effect column represents orienting effect as the difference of the spatial cue column minus the center cue column shown with t maps.
Figure 6.
Figure 6.
Time-frequency pattern of target-locked analysis of the executive control network. The source column shows the dipole sources used for the dipole modeling of the target-locked ERP. The next six columns are the power change (percentage) after onset of target with congruent and incongruent flankers compared with baseline under the no cue, center cue, and spatial cue conditions, respectively. The conflict-effect column represents the main effect of conflict (incongruent minus congruent conditions) as t maps.
Figure 7.
Figure 7.
Time-frequency pattern of response-locked analysis of the executive control network. The source column shows the dipole sources used for dipole modeling of the response-locked ERP. The incongruent and congruent columns are for the power change (percentage) before and after response with incongruent and congruent flankers compared with the baseline. The conflict-resolution column represents the response-locked conflict effect as incongruent minus congruent conditions shown as t maps.

Similar articles

Cited by

References

    1. Abdullaev YG, Posner MI. Time course of activating brain areas in generating verbal associations. Psychol Sci. 1997;8:56–59.
    1. Babiloni C, Miniussi C, Babiloni F, Carducci F, Cincotti F, Del Percio C, Sirello G, Fracassi C, Nobre AC, Rossini PM. Sub-second “temporal attention” modulates alpha rhythms. A high-resolution EEG study. Brain Res Cogn Brain Res. 2004;19:259–268. - PubMed
    1. Bauer M, Oostenveld R, Peeters M, Fries P. Tactile spatial attention enhances gamma-band activity in somatosensory cortex and reduces low-frequency activity in parieto-occipital areas. J Neurosci. 2006;26:490–501. - PMC - PubMed
    1. Botvinick MM, Braver TS, Barch DM, Carter CS, Cohen JD. Conflict monitoring and cognitive control. Psychological Rev. 2001;108:624–652. - PubMed
    1. Busse L, Woldorff MG. The ERP omitted stimulus response to “no-stim” events and its implications for fast-rate event-related fMRI designs. NeuroImage. 2003;18:856–864. - PubMed

Publication types

LinkOut - more resources