Comparative Study
. 2007 Jun 6;27(23):6249-60.
doi: 10.1523/JNEUROSCI.3819-06.2007.

Localization and expression of group I metabotropic glutamate receptors in the mouse striatum, globus pallidus, and subthalamic nucleus: regulatory effects of MPTP treatment and constitutive Homer deletion

Affiliations
Comparative Study

Localization and expression of group I metabotropic glutamate receptors in the mouse striatum, globus pallidus, and subthalamic nucleus: regulatory effects of MPTP treatment and constitutive Homer deletion

Masaaki Kuwajima et al. J Neurosci. .

Abstract

Group I metabotropic glutamate receptors (mGluRs), mGluR1 and mGluR5, regulate activity in the globus pallidus (GP) and subthalamic nucleus (STN). To test whether the localization of group I mGluRs is altered in parkinsonism, we used immunoelectron microscopy to analyze the subcellular and subsynaptic distribution of mGluR1a and mGluR5 in GP and STN of 1-methyl-4-phenyl-1,2,3,6-tetrahydropyridine (MPTP)-treated mice. Homer1 and Homer2 knock-out mice were used to assess the role of Homer in MPTP-induced redistribution of group I mGluRs. We also examined the effects of MPTP on the expression levels of group I mGluRs and Homer proteins in GP and striatum. MPTP treatment significantly reduced the expression levels of H1a and mGluR1a in striatum but not in GP. Although light microscopy did not reveal noticeable effects of MPTP treatment on the distribution of group I mGluRs and Homer proteins in GP and STN, specific changes in the ultrastructural localization of mGluR1a were found in MPTP-treated normal and Homer knock-out mice. An increase in the expression of presynaptic axonal and terminal mGluR1a labeling and an increased level of mGluR1a immunoreactivity in the postsynaptic specialization of putative GABAergic synapses were among the most significant effects induced by dopamine depletion. However, neither of these changes was found for mGluR5, which, in contrast, displayed complex regulatory alterations in its subsynaptic distribution in response to Homer deletion and MPTP lesion. Thus, nigrostriatal dopaminergic lesion and Homer deletion lead to changes in the trafficking of group I mGluRs in vivo that are specific to receptor subtypes and brain areas.


Figures

Figure 1.
Figure 1.
Light microscopic immunoperoxidase and Western immunoblot analyses of TH in the striatum, GP, and STN of MPTP-treated mice. A, Representative light micrographs of DAT-immunostained basal ganglia tissue sections from SAL- and MPTP-treated mice. In STR (a, a′), GP (c, c′), and STN (d, d′), MPTP treatment resulted in the loss of DAT-labeled dopaminergic fibers. In SN (b, b′), the same MPTP treatment caused a massive loss of DAT-positive dopaminergic neurons and neuropil. Scale bars: Aa (for Aa, Aa′), Ab (for Ab, Ab′), Ac (for Ac, Ac′, Ad, Ad′), 500 μm. CP, Cerebral peduncle; IC, internal capsule; LH, lateral hypothalamus; SNc, substantia nigra pars compacta; SNr, substantia nigra pars reticulata; VTA, ventral tegmental area; ZI, zona incerta. B, Top, A representative immunoblot of the striatal tissue samples from two SAL-treated and two MPTP-treated mice, demonstrating a profound decrease in the expression level of TH, a marker for dopaminergic terminals. Bottom, Quantification of the intensity of TH-immunoreactive bands from SAL- (n = 17) and MPTP-treated (n = 14) mice, expressed as mean ± SEM. Note that the MPTP treatment causes >90% reduction in TH level on average.
Figure 2.
Figure 2.
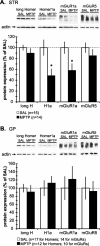
Western immunoblot analysis of the total tissue expression levels of group I mGluRs and Homer proteins in the STR and GP of saline- and MPTP-treated mice. A, Top, Representative immunoblots of the striatal tissue samples from two SAL-treated and two MPTP-treated mice, probed for (from left) long Homer, H1a, mGluR1a, and mGluR5. The molecular weights of long Homer and H1a were ∼45 kDa and ∼27 kDa, respectively. Both mGluR1a and mGluR5 migrated as monomers and multimers with the molecular weight ranging from ∼130 to ∼250 kDa. Actin was used as loading control and was unaffected by MPTP treatment. Note that the intensity of immunoreactive bands for H1a and mGluR1a in the MPTP mice is less than the saline-treated mice. Bottom, Quantification of the intensity of immunoreactive bands from the striatal samples from SAL- (n = 15) and MPTP-treated (n = 14) mice. All values are normalized to the saline-treated group and expressed as mean ± SEM. Note that MPTP treatment causes ∼50% and ∼40% reduction in H1a and mGluR1a levels, respectively (*p < 0.05; t test). B, Top, Representative immunoblots of GP tissue samples from two SAL-treated and two MPTP-treated mice, probed for (from left) long Homer, H1a, mGluR1a, and mGluR5. Note that the intensity of immunoreactive bands for Homer proteins and group I mGluRs is not altered by MPTP treatment. Bottom, Quantification of the intensity of immunoreactive bands from the striatal samples from SAL- (n = 15) and MPTP-treated (n = 14) mice reveals that MPTP treatment had no effect on the expression levels of Homer proteins and group I mGluRs in GP. All values are normalized to the saline-treated group and expressed as mean ± SEM.
Figure 3.
Figure 3.
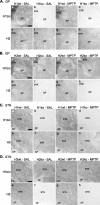
LM immunoperoxidase labeling for Homer proteins in GP and STN of wild-type and Homer-deficient mice treated with MPTP or saline. A, Immunoreactivity for Homer proteins in the GP of H1 mice. a–d, H1b/c protein is comparably expressed in the neuropil of GP in saline-treated (a) and MPTP-treated (c) H1wt. The lack of H1b/c ir in H1ko (b, d) indicates the specificity of the anti-H1b/c antibody. e–h, The pattern and intensity of H2 ir in GP did not show marked alteration by MPTP treatment and/or H1 deletion. B, Immunoreactivity for Homer proteins in the GP of H2 mice. a–d, The pattern and intensity of H1b/c ir in GP did not show marked alteration by MPTP treatment and/or H2 deletion. e–h, H2 protein is comparably expressed in the neuropil of GP in saline-treated (e) and MPTP-treated (g) H2wt. The lack of H2 ir in H2ko (f, h) indicates the specificity of the anti-H2 antibody. C, Immunoreactivity for Homer proteins in the STN of H1 mice. a–d, H1b/c protein is comparably expressed in the neuropil of STN in saline-treated (a) and MPTP-treated (c) H1wt. e–h, The pattern and intensity of H2 ir in STN did not show marked alteration by MPTP treatment and/or H1 deletion. D, Immunoreactivity for Homer proteins in the STN of H2 mice. a–d, The pattern and intensity of H1b/c ir in STN did not show marked alteration by MPTP treatment and/or H2 deletion. e–h, H2 protein is comparably expressed in the neuropil of STN in saline-treated (e) and MPTP-treated (g) H2wt. Scale bars: Aa (for Aa–Ah), Ba (for Ba–Bh), Ca (for Ca–Ch), Da (Da–Dh), 50 μm. CP, Cerebral peduncle.
Figure 4.
Figure 4.
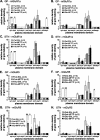
LM and EM immunoperoxidase localization of mGluR1a in GP and STN of wild-type and Homer-deficient mice treated with MPTP or saline. A, Immunoperoxidase labeling for mGluR1a in GP at light microscopic level shows densely stained neuropil and perikarya (white arrowheads). B, Immunoreactivity for mGluR1a is mainly expressed in dendrites and unmyelinated axons. Note that mGluR1a labeling in a longitudinally cut unmyelinated axon (ax) appears as a discrete patch of peroxidase reaction product along the length of the axon. C, D, Histograms summarizing the subcellular localization of mGluR1a in GP neuropil of Homer1 (C) and Homer2 (D) mice, expressed as the mean ± SEM density of labeled elements per 100 μm2 of GP tissue. Note that statistically significant differences were found in the density of mGluR1a-immunopositive axon terminals (C, D, term.; *p < 0.05; Tukey test) and that of mGluR1a-labeled glial processes (D, glia; *p < 0.05; Tukey test). E, Immunoperoxidase labeling for mGluR1a in STN at light microscopic level shows densely stained neuropil and perikarya (white arrowheads). F, Immunoreactivity for mGluR1a is mainly expressed in dendrites, with occasional labeling in unmyelinated axons. G, H, Histograms summarizing the subcellular localization of mGluR1a in STN neuropil of Homer1 (G) and Homer2 (H) mice, expressed as the mean ± SEM density of labeled elements per 100 μm2 of STN tissue. Note that statistically significant differences were found in the density of mGluR1a-immunopositive unmyelinated axons (H, u.ax.; *p < 0.05; Tukey test). CP, Cerebral peduncle; den, dendrites; u.ax., unmyelinated axons; m.ax., myelinated axons; term., terminal boutons; glia, glial processes. Scale bars: A, E, 50 μm; B, F, 0.5 μm.
Figure 5.
Figure 5.
LM and EM immunoperoxidase localization of mGluR5 in GP and STN of wild-type and Homer-deficient mice treated with MPTP or saline. A, Immunoperoxidase labeling for mGluR5 in GP at light microscopic level shows densely stained neuropil and perikarya (white arrowheads). B, Immunoreactivity for mGluR5 is mainly expressed in dendrites, unmyelinated axons (ax), and glial processes (g). C, D, Histograms summarizing the subcellular localization of mGluR5 in GP neuropil of Homer1 (C) and Homer2 (D) mice, expressed as the mean ± SEM density of labeled elements per 100 μm2 of GP tissue. Note that statistically significant differences were found in the density of mGluR5-labeled glial processes (C, glia; *p < 0.05; Tukey test). E, Immunoperoxidase labeling for mGluR5 in STN at light microscopic level shows densely stained neuropil and perikarya (white arrowheads). F, Immunoreactivity for mGluR5 is mainly expressed in dendrites, with occasional labeling in glial processes (g). G, H, Histograms summarizing the subcellular localization of mGluR5 in STN neuropil of Homer1 (G) and Homer2 (H) mice, expressed as the mean ± SEM density of labeled elements per 100 μm2 of STN tissue. CP, Cerebral peduncle; den, dendrites; u.ax., unmyelinated axons; m.ax., myelinated axons; term., terminal boutons; glia, glial processes. Scale bars: A, E, 50 μm; B, F, 0.5 μm.
Figure 6.
Figure 6.
Preembedding immunogold labeling for mGluR1a and mGluR5 in GP and STN of wild-type and Homer-deficient mice treated with saline or MPTP. A, B, Relative proportion of the plasma membrane-bound gold labeling for mGluR1a and mGluR5 in GP dendrites of Homer1 (A) and Homer2 (B) mice. Note that the proportion of plasma membrane-bound mGluR1a labeling is higher than that of mGluR5 labeling. Neither MPTP treatment nor H1 deletion significantly altered the plasma membrane expression of group I mGluRs. C, D, Electron micrographs of GP dendrites labeled for mGluR1a (C) or mGluR5 (D), contacted by axon terminals that establish asymmetric (large arrow) or symmetric (black arrowhead) synapses. Note the immunogold labeling at the edges of symmetric (D, small arrow) and asymmetric (C, small arrow) synapses, as well as within the main body of symmetric synapses (C, white arrowhead). E, F, Relative proportion of the plasma membrane-bound gold labeling for mGluR1a and mGluR5 in STN dendrites of Homer1 (E) and Homer2 (F) mice. Note that the proportion of the plasma membrane-bound mGluR1a labeling is higher than that of mGluR5 labeling. Neither MPTP treatment nor H1 deletion significantly altered the plasma membrane expression of group I mGluRs. G, H, Electron micrographs of STN dendrites labeled for mGluR1a (G) or mGluR5 (H), contacted by terminal boutons that establish asymmetric (large arrow) or symmetric (black arrowhead) synapses. Note that immunogold labeling is found at the edges of symmetric (G, small arrow) and asymmetric (G, H, small arrows) synapses. Data presented here and in Figure 7 were compiled from 5039 gold particles in 819 GP dendrites from 24 animals for mGluR1a, 5865 gold particles in 797 GP dendrites from 24 animals for mGluR5, 4419 particles in 905 STN dendrites from 24 animals for mGluR1a, and 5682 particles in 826 STN dendrites from 24 animals for mGluR5. AT, Axon terminals; den, dendrites. Scale bar: C (for C, D, G, H), 0.5 μm.
Figure 7.
Figure 7.
RD ± SEM of immunogold labeling for mGluR1a (A–D) and mGluR5 (E–H) at different domain of the dendritic plasma membrane in GP (A, B, E, F) and STN (C, D, G, H). Values were calculated as the percentage of labeling for each receptor subtype at a given membrane domain divided by the percentage of the dendritic plasma membrane that contributes to that domain. Note that, in all cases, group I mGluRs are highly concentrated at the edges of asymmetric synapses (peri-asym) and, to a lesser extent, symmetric synapses (peri-sym). A, C, MPTP treatment significantly increased the RD of mGluR1a at symmetric synapses in GP (A) and STN (C) of H1wt and H1ko mice (A, C, syn-sym; *p < 0.05; ** p < 0.01; Tukey test), whereas extrasynaptic mGluR1a was significantly reduced in the GP of H1ko mice (A, extrasyn; *p < 0.05; Tukey test). F, H2 deletion significantly increased the density of synaptic mGluR5 at symmetric synapses (F, syn-sym; *p < 0.05; Tukey test), which was reversed by MPTP treatment of H2ko mice (F, syn-sym; **p < 0.01; Tukey test). The RD of extrasynaptic mGluR5 was also significantly increased by MPTP treatment in H2wt (F, extrasyn; *p < 0.05; Tukey test). G, The RD of perisynaptic mGluR5 was significantly increased by MPTP treatment in H1wt (G, peri-sym; **p < 0.01; Tukey test), which was reversed in MPTP-treated H1ko (G, peri-sym; *p < 0.05; Tukey test).

Similar articles

Cited by

References

    1. Ango F, Pin JP, Tu JC, Xiao B, Worley PF, Bockaert J, Fagni L. Dendritic and axonal targeting of type 5 metabotropic glutamate receptor is regulated by homer1 proteins and neuronal excitation. J Neurosci. 2000;20:8710–8716. - PMC - PubMed
    1. Awad H, Hubert GW, Smith Y, Levey AI, Conn PJ. Activation of metabotropic glutamate receptor 5 has direct excitatory effects and potentiates NMDA receptor currents in neurons of the subthalamic nucleus. J Neurosci. 2000;20:7871–7879. - PMC - PubMed
    1. Awad-Granko H, Conn PJ. Activation of groups I or III metabotropic glutamate receptors inhibits excitatory transmission in the rat subthalamic nucleus. Neuropharmacology. 2001;41:32–41. - PubMed
    1. Betarbet R, Porter RH, Greenamyre JT. GluR1 glutamate receptor subunit is regulated differentially in the primate basal ganglia following nigrostriatal dopamine denervation. J Neurochem. 2000;74:1166–1174. - PubMed
    1. Bezard E, Dovero S, Bioulac B, Gross C. Effects of different schedules of MPTP administration on dopaminergic neurodegeneration in mice. Exp Neurol. 1997;148:288–292. - PubMed

Publication types

MeSH terms

Substances

LinkOut - more resources