Comparative Study
. 2007 Jun 6;27(23):6273-81.
doi: 10.1523/JNEUROSCI.1024-07.2007.

The transporters GlyT2 and VIAAT cooperate to determine the vesicular glycinergic phenotype

Affiliations
Comparative Study

The transporters GlyT2 and VIAAT cooperate to determine the vesicular glycinergic phenotype

Karin R Aubrey et al. J Neurosci. .

Abstract

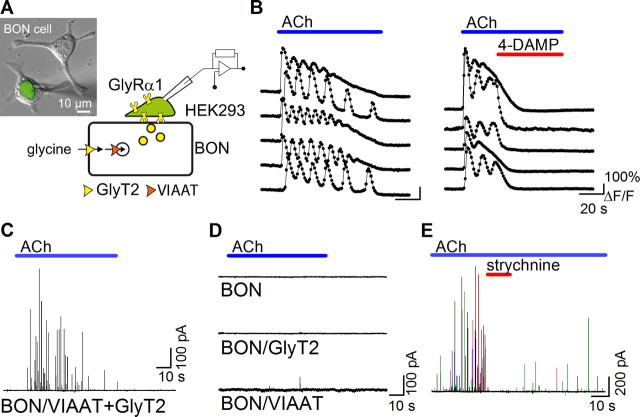
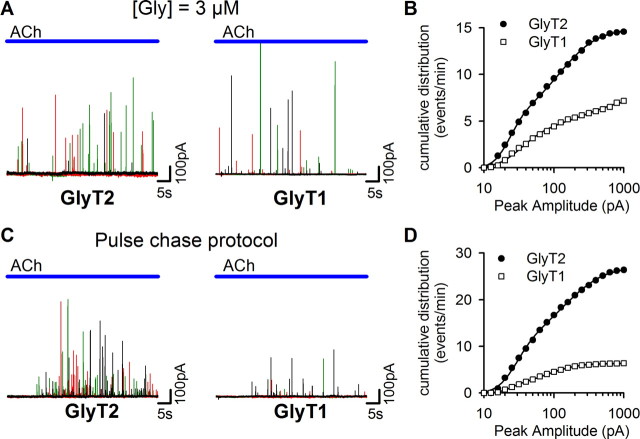
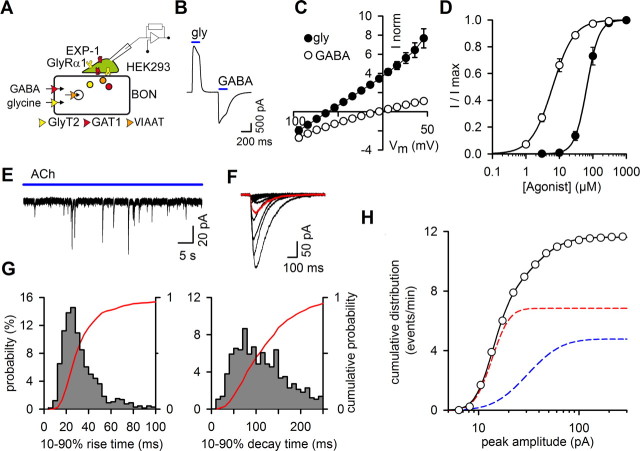
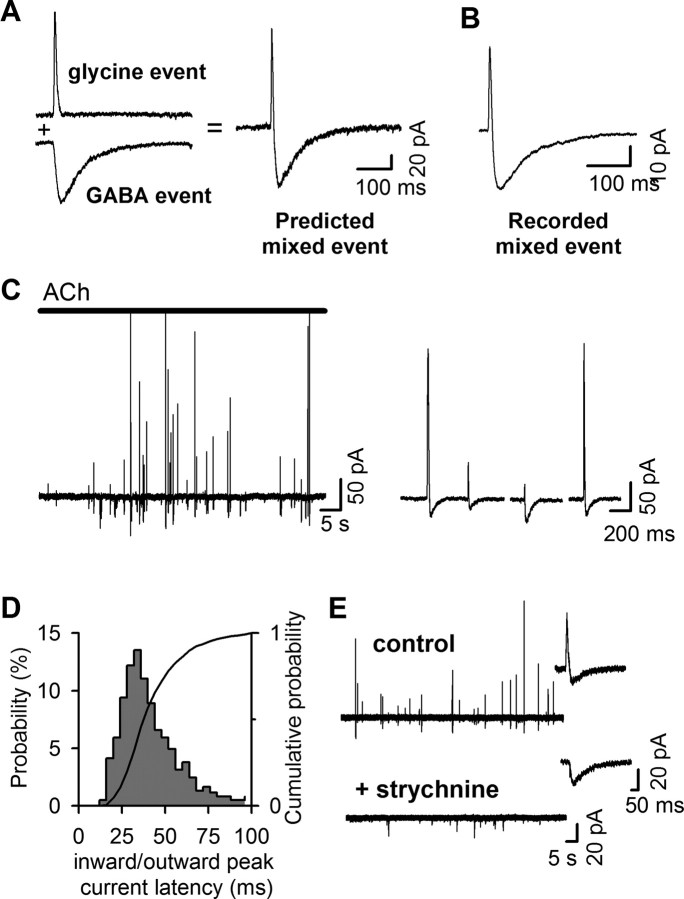
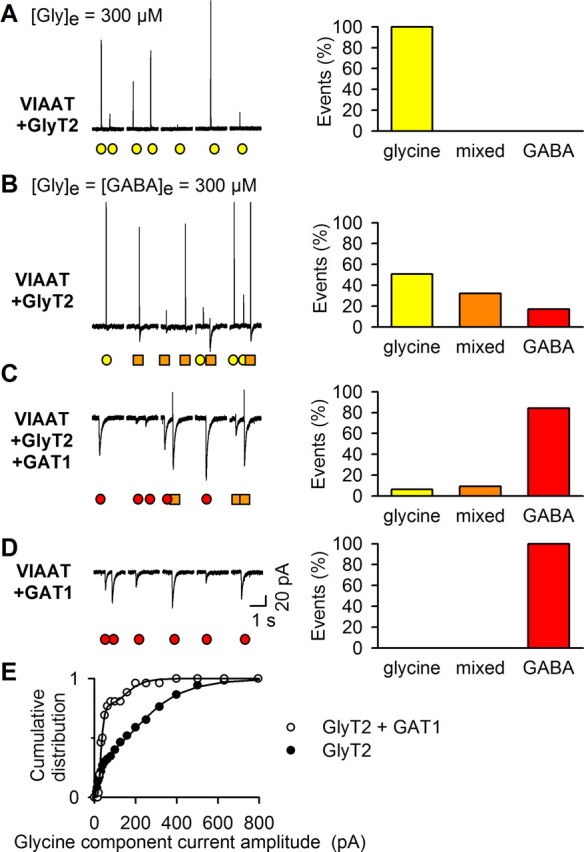
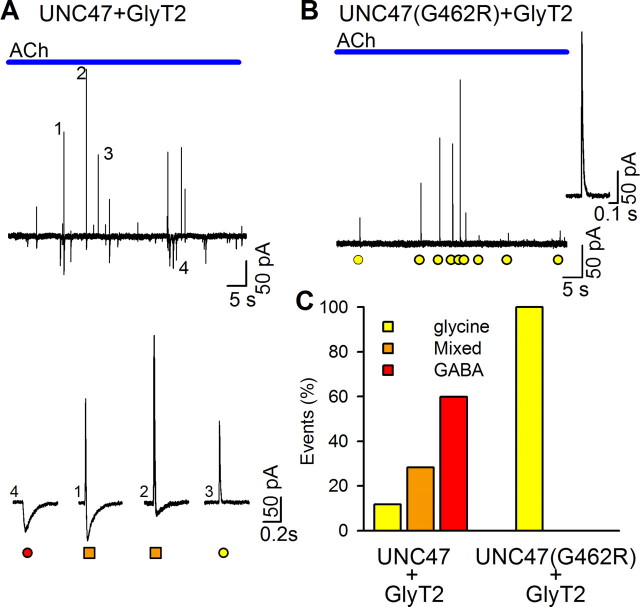
The mechanisms that specify the vesicular phenotype of inhibitory interneurons in vertebrates are poorly understood because the two main inhibitory transmitters, glycine and GABA, share the same vesicular inhibitory amino acid transporter (VIAAT) and are both present in neurons during postnatal development. We have expressed VIAAT and the plasmalemmal transporters for glycine and GABA in a neuroendocrine cell line and measured the quantal release of glycine and GABA using a novel double-sniffer patch-clamp technique. We found that glycine is released from vesicles when VIAAT is coexpressed with either the neuronal transporter GlyT2 or the glial transporter GlyT1. However, GlyT2 was more effective than GlyT1, probably because GlyT2 is unable to operate in the reverse mode, which gives it an advantage in maintaining the high cytosolic glycine concentration required for efficient vesicular loading by VIAAT. The vesicular inhibitory phenotype was gradually altered from glycinergic to GABAergic through mixed events when GABA is introduced into the secretory cell and competes for uptake by VIAAT. Interestingly, the VIAAT ortholog from Caenorhabditis elegans (UNC-47), a species lacking glycine transmission, also supports glycine exocytosis in the presence of GlyT2, and a point mutation of UNC-47 that abolishes GABA transmission in the worm confers glycine specificity. Together, these results suggest that an increased cytosolic availability of glycine in VIAAT-containing terminals was crucial for the emergence of glycinergic transmission in vertebrates.


Figures

Figure 1.
Figure 1.
VIAAT and GlyT2 coexpression promotes quantal glycine release. A, Schematic representation of the BON/HEK293 model. The micrograph is an overlay of phase contrast and green fluorescence images that shows two BON cells and a patch-clamped HEK293 cell expressing EGFP pressed on top of one of the BON cells. B, Left, Time course of Fluo4/AM fluorescence change in five representative BON/VIAAT cells evoked by the application of acetylcholine (bar, 100 μm). Right, Application of 4-DAMP (0.1 μm, red bar), a non-M2 muscarinic receptor antagonist, blocks the Ca2+ oscillations evoked by acetylcholine in five representative BON/VIAAT cells. C, A representative current trace recorded with a HEK/GlyR cell during ACh stimulation (bar, 100 μm) of a BON/VIAAT+GlyT2 cells after overnight incubation with glycine-containing media (300 μm). Transient currents were recorded from 114/301 BON/VIAAT+GlyT2 cells tested. D, No events were detected from naive BON cells (top trace, 18/18 cells) or from BON/GlyT2 cells (middle trace, 31/31 cells). No (in 60/71 cells) or small, low frequency transient currents (in 11/71 cells) were detected from BON/VIAAT cells (bottom trace). E, Transient currents recorded from BON/VIAAT+GlyT2 cells were blocked with strychnine (0.5 μm, red bar; four superimposed ACh applications are shown with different colors).
Figure 2.
Figure 2.
Characteristics of the glycine events. A, Left, A current trace illustrating the broad range of glycine-events amplitudes. Right, Expanded view of 153 successive exocytotic events and their average (red trace) recorded during eight ACh applications to a single BON/VIAAT+GlyT2 cell. B, Small and large glycine-events (left) have comparable activation kinetics when normalized (right). C, Distribution probabilities of the 10–90% rise time (left) and 10–90% decay time (right) of glycine events (n = 4199). The cumulative probabilities are shown in red. D, Histograms of number (left) and first-latency (right) of the glycine-events recorded during each ACh application (n = 41). E, Normalized cumulative distribution of glycine-event peak-amplitudes recorded from five BON/VIAAT+GlyT2 cells (closed circles; 44 ACh applications, 688 events) incubated overnight in 300 μm glycine. The solid line corresponds to the fit of the data with the sum of two log-normal cumulative distribution functions (see Materials and Methods). The dashed lines represent the individual distributions with n1 = 5.7, μ1 = 3.4, σ1 = 0.49 (red line) and n2 = 9.3, μ2 = 5.1, σ2 = 1.0 (blue line).
Figure 3.
Figure 3.
GlyT2 supports glycine release more efficiently than GlyT1. A, Representative glycine release events recorded with a HEK/GlyR cell apposed to BON/VIAAT+GlyT2 or BON/VIAAT+GlyT1 cells incubated for 12–24 h in [Gly]e = 3 μm. The current traces correspond to three successive ACh applications and are shown with different colors. B, The normalized cumulative distribution of glycine-event peak amplitudes recorded from eight BON/VIAAT+GlyT2 cells (closed circles; 59 Ach applications, 871 events) or from eight BON/VIAAT+GlyT1 cells (open squares; 37 Ach applications, 272 events) incubated overnight in 3 μm glycine. The solid line corresponds to the fit of the data with the sum of two log-normal cumulative distribution functions (n1 = 5.1, μ1 = 3.13, σ1 = 0.41, n2 = 9.6, μ2 = 4.7, σ2 = 1.0 for GlyT2; and n1 = 3.7, μ1 = 3.5, σ1 = 0.6, n2 = 4.1, μ2 = 5.7, σ2 = 1.37 for GlyT1). C, Representative glycine release events recorded with a BON/VIAAT cell expressing GlyT2 or GlyT1, as in A, but after a pulse-chase glycine-loading protocol: after transfection, BON cells were maintained in nominally glycine-free media and exposed to 30 μm glycine for 30 min 14–20 h before experiments. D, The normalized cumulative distribution of the glycine-event peak amplitudes recorded from five BON/VIAAT+GlyT2 cells (closed circles; 45 Ach applications, 1257 events) or from seven BON/VIAAT+GlyT1 cells (open squares; 25 Ach applications, 264 events) incubated as described in C. The solid line correspond to the fit of the data with the sum of two log-normal cumulative distribution functions (n1 = 10.1, μ1 = 3.35, σ1 = 0.48, n2 = 16.7, μ2 = 4.9; σ2 = 1.04 for GlyT2; and n1 = 1.4, μ1 = 3.2, σ1 = 0.29, n2 = 4.9, μ2 = 4.3; σ2 = 0.8 for GlyT1).
Figure 4.
Figure 4.
Detection of GABA release from BON/VIAAT cells with HEK/GlyR+EXP1 cells. A, Schematic representation of the BON/HEK293 model for the codetection of GABA and glycine release. B, Glycine and GABA (200 μm) evoked currents with opposite polarity in HEK/GlyR+EXP1 cells held at −45 mV. C, Current–voltage relationships for glycine (closed circles; 200 μm) and GABA- (open circles; 200 μm) evoked currents in HEK/GlyR+EXP1 cells. Currents were normalized to their absolute amplitude at −45 mV. D, Concentration-response curves of GlyR (filled circles; EC50 = 63.9 ± 9.1 μm; h = 2.5 ± 0.5; n = 5) and EXP1 receptors (open circles; EC50 = 6.5 ± 0.5 μm; h = 1.4 ± 0.1; n = 6) were fitted using the Hill equation. GlyR- and EXP1-receptor mediated currents properties were identical when the receptors were expressed individually or in combination. E, Current trace recorded with a HEK/GlyR+EXP1 cell apposed to a BON/VIAAT+GAT1 cell incubated overnight in the presence of GABA and glycine (300 μm each). Application of Ach (100 μm) evoked only inward currents. F, GABA events (n = 17; average trace is shown in red) recorded during a single acetylcholine application. G, Distribution probabilities of the 10–90% rise time (left) and 10–90% decay time of GABA events (n = 659). The cumulative probability is shown in red. H, Normalized cumulative distribution of the peak amplitude of GABA events (n = 659). The solid line corresponds to the fit of the sum of two log-normal distributions (dashed lines) with the values of n1 = 4.8, μ1 = 2.61, σ1 = 0.3 (red line) and n2 = 6.8, μ2 = 3.42, σ2 = 0.61 (blue line).
Figure 5.
Figure 5.
Detection of glycine and GABA corelease from individual vesicles. A, Algebraic sum of representative glycine and GABA events (left) predicts a biphasic unitary event (right) if glycine and GABA are released simultaneously. B, A representative unitary mixed event recorded with HEK/GlyR+EXP1 cell during ACh stimulation of a BON/VIAAT+GlyT2 cell incubated overnight in the presence of 300 μm GABA and glycine, reflecting GABA and glycine corelease from a single vesicle. C, Current trace with pure GABA and mixed events recorded during a single ACh application to a BON/VIAAT+GlyT2 cell incubated overnight in the presence of glycine and GABA. For clarity, the outward current amplitude scale was fixed at 300 pA. The inset shows traces of four consecutive mixed events with different peak amplitudes for the outward and inward currents. D, Histogram of the latency between the outward and inward peak current of mixed events. The solid line represents the cumulative probability. E, The glycine outward component of mixed events (top, insert) evoked during ACh application is blocked by the addition of 1 μm strychnine (bottom, insert), with no change in release rate.
Figure 6.
Figure 6.
GlyT2-mediated [Gly]i can compete effectively with GABA for uptake by VIAAT. A–D, Left, Examples of five consecutive 2 s recordings of quantal release during a single ACh application to BON/VIAAT+GlyT2 (A, B), BON/VIAAT+GlyT2+GAT1 (C), and BON/VIAAT+GAT1 (D) cells incubated in [Gly]e = 300 μm without GABA (A) or in [Gly]e = [GABA]e = 300 μm (B–D). Glycine, mixed, and GABA events are indicated by yellow circles, orange squares, and red circles, respectively. Right, Proportions of glycine, mixed, and GABA events for 679 (A), 660 (B), 625 (C), and 512 (D) events recorded from 9 to 15 BON cells per condition. The number of glycine, mixed, and GABA events detected were 679, 0, 0 (A); 336, 212, 110 (B); 40, 58, 527 (C); and 0, 0, 512 (D), respectively, for the different conditions described above. E, Cumulative distribution of the peak amplitude of the glycine component of mixed currents recorded from BON/VIAAT cells expressing GlyT2 alone (closed circles; n = 20 cells) (see Fig. 6B) or in combination with GAT1 (open circles; n = 7 cells) (see Fig. 6C). The mean glycine component of mixed events decreases from 153.8 ± 14.2 pA (n = 127) to 58.0 ± 13.4 pA (n = 26) when GAT1 is expressed (p = 0.016; two-tailed Mann–Whitney test).
Figure 7.
Figure 7.
The vesicular GABA transporter of C. elegans, UNC-47 accumulates glycine and the mutation G462R confers glycine specificity. A, Current trace recorded with a HEK/GlyR+EXP1 cell apposed to a BON/UNC47+GlyT2 cell during a single ACh application (top trace). Numbers mark the GABA, mixed, and glycine events shown below (red circle, orange squares, and yellow circles, respectively). B, In contrast, only pure glycinergic events are detected from BON/UNC47(G462R)+GlyT2 cells. C, Bar graph of the proportions of cumulative glycine, mixed, and GABA events from five BON/UNC-47+GlyT2 cells (777 events) and 14 BON/UNC-47(G462R) cells (259 events). The number of glycine, mixed, and GABA events detected were 91, 220, 466 for the BON/UNC-47+GlyT2 and 259, 0, 0 for the BON/UNC-47(G462R) cells.

Similar articles

Cited by

References

    1. Ahmadi S, Muth-Selbach U, Lauterbach A, Lipfert P, Neuhuber WL, Zeilhofer HU. Facilitation of spinal NMDA receptor currents by spillover of synaptically released glycine. Science. 2003;300:2094–2097. - PubMed
    1. Aubrey KR, Vandenberg RJ, Clements JD. Dynamics of forward and reverse transport by the glial glycine transporter, glyt1b. Biophys J. 2005;89:1657–1668. - PMC - PubMed
    1. Bargmann CI. Neurobiology of the Caenorhabditis elegans genome. Science. 1998;282:2028–2033. - PubMed
    1. Bedet C, Isambert MF, Henry JP, Gasnier B. Constitutive phosphorylation of the vesicular inhibitory amino acid transporter in rat central nervous system. J Neurochem. 2000;75:1654–1663. - PubMed
    1. Beg AA, Jorgensen EM. EXP-1 is an excitatory GABA-gated cation channel. Nat Neurosci. 2003;6:1145–1152. - PubMed

Publication types

MeSH terms

Substances

LinkOut - more resources