. 2007 Jun 28;447(7148):1130-4.
doi: 10.1038/nature05939. Epub 2007 Jun 6.

A microRNA component of the p53 tumour suppressor network

Affiliations

A microRNA component of the p53 tumour suppressor network

Lin He et al. Nature. .

Abstract

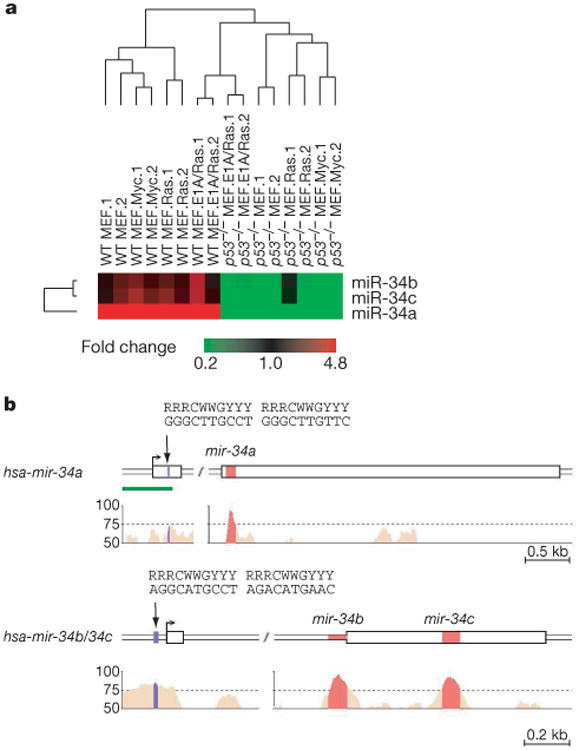
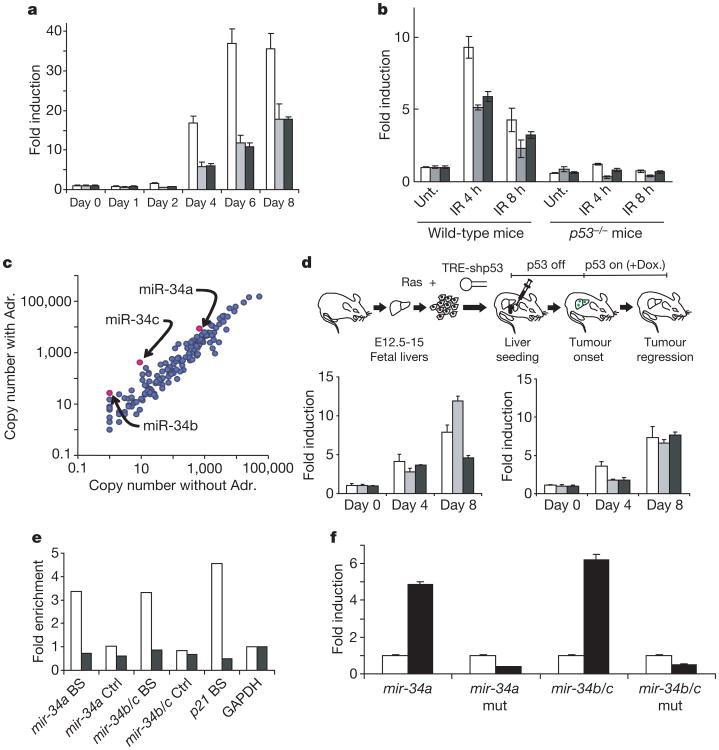
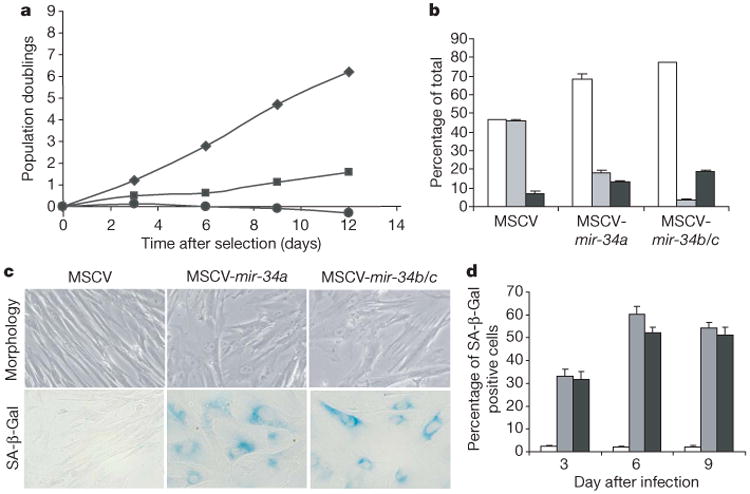
A global decrease in microRNA (miRNA) levels is often observed in human cancers, indicating that small RNAs may have an intrinsic function in tumour suppression. To identify miRNA components of tumour suppressor pathways, we compared miRNA expression profiles of wild-type and p53-deficient cells. Here we describe a family of miRNAs, miR-34a-c, whose expression reflected p53 status. Genes encoding miRNAs in the miR-34 family are direct transcriptional targets of p53, whose induction by DNA damage and oncogenic stress depends on p53 both in vitro and in vivo. Ectopic expression of miR-34 induces cell cycle arrest in both primary and tumour-derived cell lines, which is consistent with the observed ability of miR-34 to downregulate a programme of genes promoting cell cycle progression. The p53 network suppresses tumour formation through the coordinated activation of multiple transcriptional targets, and miR-34 may act in concert with other effectors to inhibit inappropriate cell proliferation.


Figures

Figure 1
Figure 1. Expression of miR-34 is correlated with p53 status in MEFs
a, An unsupervised hierarchical clustering based on miRNA expression profiles in wild-type and p53−/− MEFs with the indicated additional genetic alteration. Two independently constructed cell lines (.1 and .2) were analysed in each case. The complete heat map (linear scale) is presented in Supplementary Fig. S1. b, Predicted gene structures for human mir-34a and mir-34b/c were generated by combining information from expressed sequence tag databases, CAGE databases and 5′ rapid amplification of cDNA ends. Sequence conservation between human, mouse and rat are represented as the percentage of conservation in the Vista analysis shown in the lower panel. The promoter regions of mir-34a and mir-34b/c each contain a palindromic sequence (shown in blue) that matches the canonical p53 binding site. The green bar indicates a CpG island. kb, kilobase.
Figure 2
Figure 2. Genes encoding miR-34 are direct targets of p53
a, miR-34 levels were measured in MEFs expressing a tetracycline-repressible p53 shRNA at the indicated times after the addition of doxycycline. White columns, mature miR-34a; grey columns, mature miR-34b; black columns, mature miR-34c. b, Wild-type and p53−/− animals were subjected to 6 Gy of ionizing radiation (IR), and miR-34 levels (identified as in a) were measured in spleens by Taqman assays both before and at the indicated times after irradiation. Unt., unirradiated. c, A group of 191 miRNAs and selected miRNA* sequences were quantified by QRT-PCR in TOV21G cells before and after treatment with 0.1 μg ml−1 adriamycin (Adr.). Results are presented in a logarithmic-scale dot plot of copy number per cell. The full data set is presented in Supplementary Table S1. d, Hepatocellular carcinomas were produced by combined expression of activated Ras and a conditional p53 shRNA. p53 suppression was relieved by treatment with doxycycline (Dox.). Tumours were harvested at the indicated times during treatment with doxycycline, and levels of mature miR-34 were measured by Taqman assays. Levels are plotted with respect to tumours before p53 reactivation. Left: white columns, pri-mir-34a; grey columns, pri-mir-34b/34c; black columns, mp21. Right: column colours as in a. e, ChIPs were performed with p53 antibodies on wild-type MEFs (white columns) or p53−/− MEFs (black columns) treated with adriamycin. BS indicates quantification of the fragment containing the predicted p53 binding site in the mir-34a, mir-34b/c or p21 promoter regions, and Ctrl indicates a 3′ fragment from the same gene. Signals were normalized to glyceraldehyde-3-phosphate dehydrogenase (GAPDH) for each genotype. f, Firefly luciferase coding sequences were placed under the transcriptional control of human mir-34a or mir-34b/c promoter elements containing either wild-type or mutant (as indicated) p53 binding sites. These reporters were co-transfected with either control (white columns) or human p53 expression plasmids (black columns). Transfections were normalized by using a simultaneously delivered Renilla luciferase expression plasmid, pRLTK. In all cases, error bars indicate s.d. (n = 3).
Figure 3
Figure 3. miR-34 family miRNAs mediate growth arrest in a variety of cell types
a, Proliferation of IMR90 cells was measured as cumulative population doublings after retroviral delivery of vectors directing the expression of primary miR-34a (squares), miR-34b/c (circles) or a control MSCV vector (diamonds). Measurements were initiated immediately after selection with puromycin. b, Cell cycle analysis was performed 1 day after selection with puromycin by BrdU/FACS on IMR90 cells engineered as in a. White columns, G1; grey columns, S; black columns, G2/M. c, IMR90 cells engineered to express pri-miR-34a or pri-miR-34b/c showed morphological alterations similar to those seen in senescent cells. d, Percentages of SA-β-Gal-positive cells were determined at 3, 6 and 9 days after the completion of selection with puromycin. White columns, MSCV; grey columns, MSCV-mir-34a; black columns, MSCV-mir-34b/c. In all cases, error bars indicate s.e.m. (n = 3).
Figure 4
Figure 4. miR-34 regulates a programme of cell cycle and DNA damage response genes
a, Western blots were used to measure protein levels after miR-34 delivery for multiple candidate targets identified in the cell cycle overlapping gene set in Supplementary Fig. S6. Tub., tubulin. b, Reporter plasmids in which the luciferase coding sequence had been fused to the 3′ UTR of CDK4, CCNE2 or MET, as indicated, were transfected into HeLa cells in conjunction with either miR-34a (grey columns) or miR-124a (white columns) siRNAs. Luciferase activity was normalized relative to a simultaneously transfected Renilla expression plasmid. In each case 3′-UTR-Mut indicates the introduction of alterations into the seed complementary sites shown in Supplementary Fig. S8. Error bars indicate s.e.m. (n = 3). c, HCT116 Dicerex5 cells were transfected with siRNAs targeting CDK4, CCNE2 and MET, and cell cycle effects were analysed as described in Supplementary Fig. S6. The somewhat less efficacious arrest on transfection with CCNE2 siRNA could reflect a partly redundant function or less potent suppression of its mRNA.

References

    1. Lu J, et al. MicroRNA expression profiles classify human cancers. Nature. 2005;435:834–838. - PubMed
    1. Thomson JM, et al. Extensive post-transcriptional regulation of microRNAs and its implications for cancer. Genes Dev. 2006;20:2202–2207. - PMC - PubMed
    1. Levine AJ, Hu W, Feng Z. The p53 pathway: what questions remain to be explored? Cell Death Differ. 2006;13:1027–1036. - PubMed
    1. Ko LJ, Prives C. p53: puzzle and paradigm. Genes Dev. 1996;10:1054–1072. - PubMed
    1. Hollstein M, Sidransky D, Vogelstein B, Harris CC. p53 mutations in human cancers. Science. 1991;253:49–53. - PubMed

Publication types