. 2007 Jun 21;447(7147):959-65.
doi: 10.1038/nature05844. Epub 2007 Jun 6.

Treatment of diabetes and atherosclerosis by inhibiting fatty-acid-binding protein aP2

Affiliations

Treatment of diabetes and atherosclerosis by inhibiting fatty-acid-binding protein aP2

Masato Furuhashi et al. Nature. .

Abstract

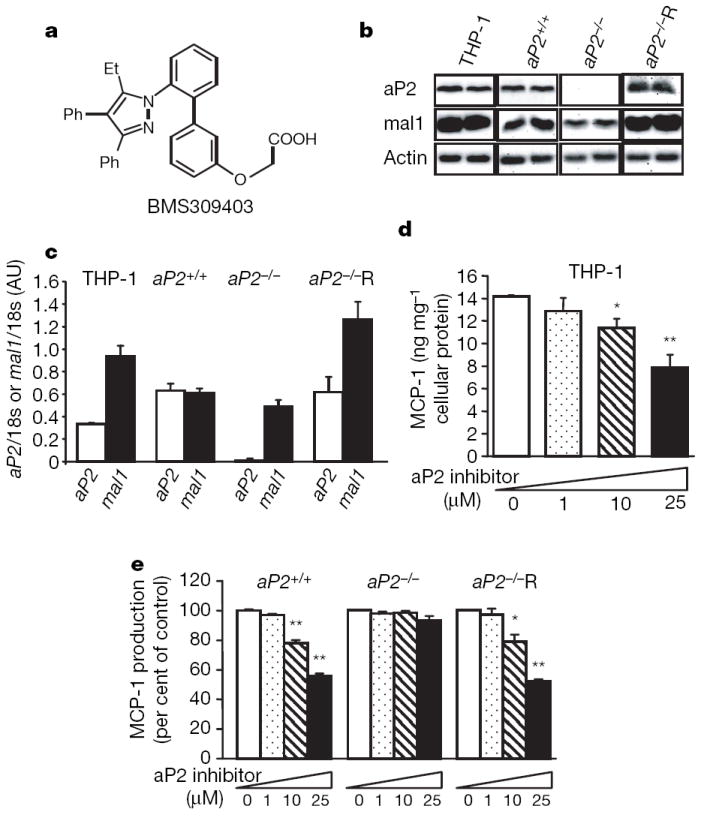
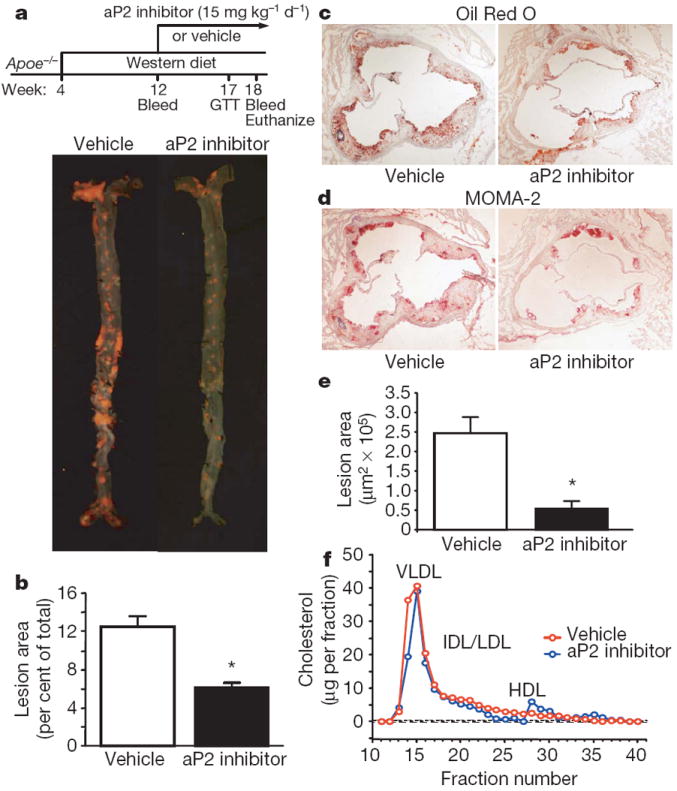
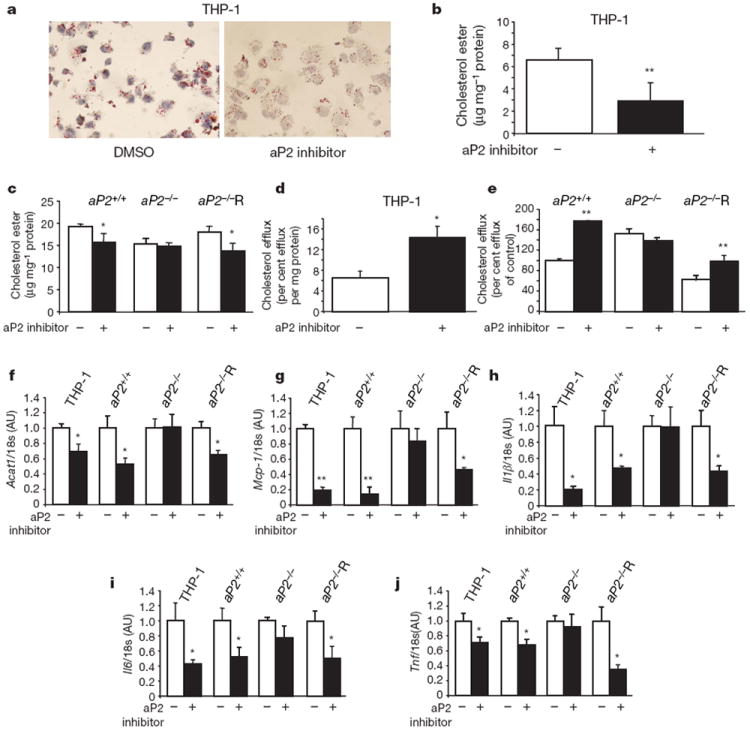
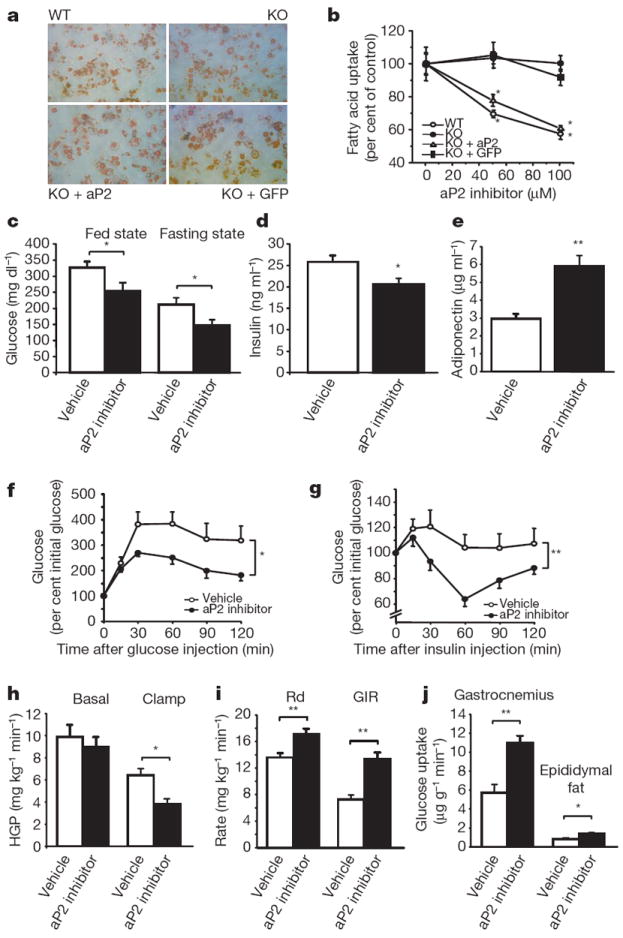
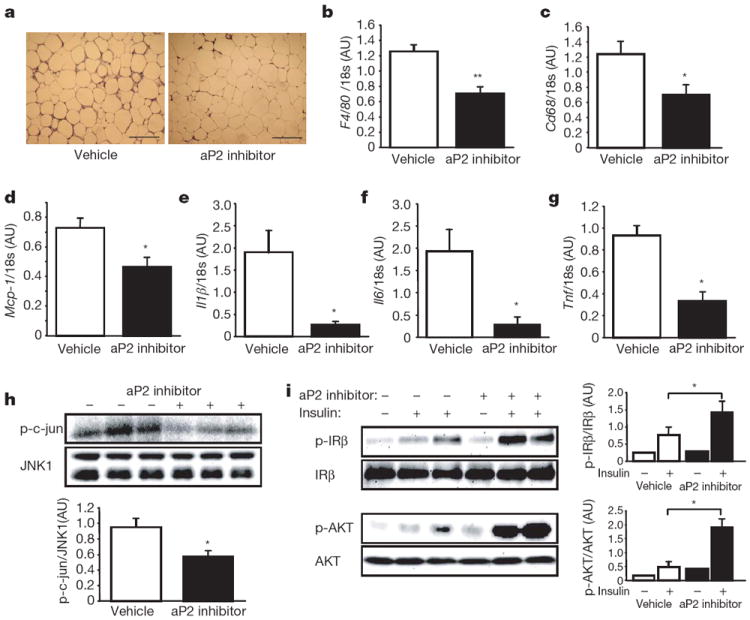
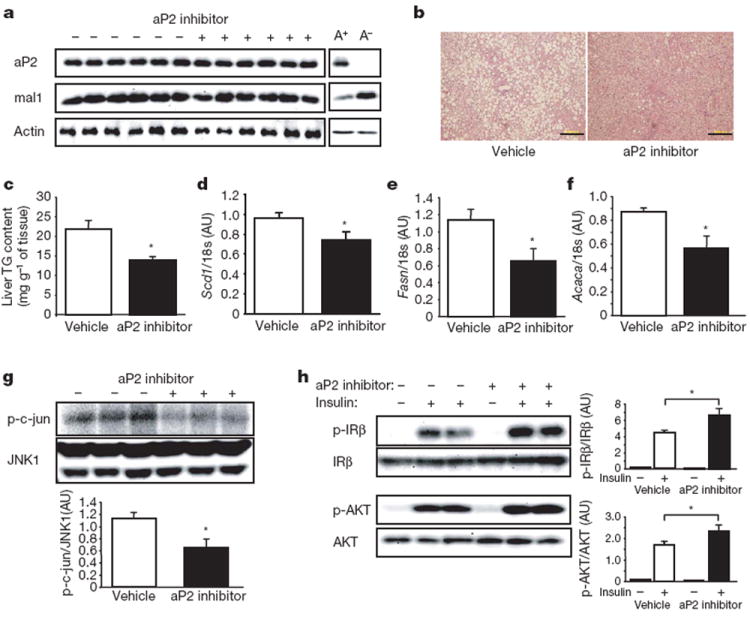
Adipocyte fatty-acid-binding protein, aP2 (FABP4) is expressed in adipocytes and macrophages, and integrates inflammatory and metabolic responses. Studies in aP2-deficient mice have shown that this lipid chaperone has a significant role in several aspects of metabolic syndrome, including type 2 diabetes and atherosclerosis. Here we demonstrate that an orally active small-molecule inhibitor of aP2 is an effective therapeutic agent against severe atherosclerosis and type 2 diabetes in mouse models. In macrophage and adipocyte cell lines with or without aP2, we also show the target specificity of this chemical intervention and its mechanisms of action on metabolic and inflammatory pathways. Our findings demonstrate that targeting aP2 with small-molecule inhibitors is possible and can lead to a new class of powerful therapeutic agents to prevent and treat metabolic diseases such as type 2 diabetes and atherosclerosis.


Conflict of interest statement

The authors declare competing financial interests: details accompany the paper at www.nature.com/nature.

Figures

Figure 1
Figure 1. Target-specific effects of aP2 inhibition on MCP-1 production in macrophages
a, Structure of the compound, BMS309403. b, Protein levels of aP2 and mal1 in human THP-1 macrophages and mouse macrophage cell lines, aP2+/+, aP2−/− and aP2−/−R. c, aP2 and mal1 mRNA levels analysed by quantitative real-time PCR. d, MCP-1 production in human THP-1 macrophages treated with aP2 inhibitor at the indicated concentrations for 24 h. e, MCP-1 production in mouse cell lines treated with the aP2 inhibitor at the indicated concentrations for 24 h. Data are shown as the mean ± s.e.m. *P < 0.05, **P < 0.01 compared with the control (each untreated cell line). AU, arbitrary units.
Figure 2
Figure 2. Atherosclerosis in Apoe−/− mice treated with the aP2 inhibitor
a, Experimental design of the late intervention study and en face aortas stained with Sudan IV. b, Quantitative analyses of the atherosclerotic lesion areas (per cent of total aorta surface area) in the vehicle (n = 16) and aP2 inhibitor (n = 15) groups. c, d, Oil Red O (c) and MOMA-2 (d) stainings of atherosclerotic lesions in the aortic root at the level of the aortic valves. Magnification, ×40. e, Quantitative analyses of the proximal aorta atherosclerotic lesion areas in the vehicle (n = 11) and aP2 inhibitor (n = 6) groups. f, Lipoprotein profile in Apoe−/− mice treated with vehicle (red) and aP2 inhibitor (blue) in the late intervention study. Data are presented as an average (n = 3) per cent distribution of total cholesterol for each group. Data are expressed as the mean ± s.e.m. *P < 0.01. VLDL, very low density lipoprotein; IDL, intermediate density lipoprotein; LDL, low density lipoprotein; HDL, high density lipoprotein. GTT, glucose tolerance test.
Figure 3
Figure 3. Effects of aP2 inhibitor on lipid accumulation, cholesterol efflux and inflammatory responses in macrophages
a, Oil Red O staining of THP-1 macrophage foam cells loaded with acetylated low density lipoprotein (50 μg ml−1) in the absence or presence of aP2 inhibitor (25 μM). Magnification, ×400. b, c, Cholesterol ester levels normalized to cellular protein content in human THP-1 macrophages (b) and mouse macrophage cell lines, aP2+/+, aP2−/− and aP2−/−R (c). d, e, APOA1-specific cholesterol efflux in THP-1 macrophages (d) and mouse cell lines (e) in the absence or presence of aP2 inhibitor (25 μM). f–j, Expression of Acat1 (f) and chemoattractant and inflammatory cytokines, Mcp-1 (g), Il1β (h), Il6 (i), and Tnf (j) in macrophages normalized to 18s rRNA levels. Data are normalized to untreated cells and expressed as the mean ± s.e.m. *P < 0.05, **P < 0.01 compared with the control (each untreated cell line). DMSO, dimethyl sulphoxide.
Figure 4
Figure 4. Metabolic studies in aP2-inhibitor-treated adipocytes and ob/ob mice
a, Oil Red O staining of wild-type (WT), FABP-deficient (KO), FABP-deficient reconstituted with aP2 (KO + aP2), and FABP-deficient with vector (KO + GFP) adipocyte cell lines. b, Fatty acid uptake using 3H-stearate in adipocyte cell lines. c, Blood glucose levels in ob/ob mice treated with vehicle (n = 6) or aP2 inhibitor (n = 6) at the fed state after 2 weeks of treatment and at the fasting state after 6 weeks of treatment. d, e, Plasma levels of insulin (d) and adiponectin (e) in ob/ob mice treated with vehicle (n = 6) or aP2 inhibitor (n = 6) for 6 weeks. f, Glucose tolerance tests performed after 4 weeks of treatment in ob/ob mice with vehicle (open circle, n = 6) or aP2 inhibitor (closed circle, n = 6). g, Insulin tolerance tests performed after 5 weeks of treatment in ob/ob mice with vehicle (open circle, n = 6) or aP2 inhibitor (closed circle, n = 6). h–j, Hyperinsulinaemic–euglycaemic clamp studies performed in ob/ob mice treated with vehicle (n = 7) or aP2 inhibitor (n = 9) for 4 weeks. Basal and clamp hepatic glucose production (HGP) (h), glucose disposal rate (Rd) and glucose infusion rate (GIR) (i), and tissue glucose uptake in gastrocnemius muscle and epididymal fat (j). Data are shown as the mean ± s.e.m. *P < 0.05, **P < 0.01.
Figure 5
Figure 5. Effects of aP2 inhibitor in adipose tissue of ob/ob mice
a, Haematoxylin and eosin staining of the adipose tissue in ob/ob mice treated with vehicle or aP2 inhibitor. Scale bar, 200 μm. b–g, Expression of F4/80 (b), Cd68 (c), Mcp-1 (d), Il1β (e), Il6 (f), and Tnf (g) in the adipose tissue of ob/ob mice treated with vehicle (n = 6) or aP2 inhibitor (n = 6). h, JNK1 activity in the adipose tissue of ob/ob mice. Quantification is shown in the graph below. i, Insulin-stimulated IRβ tyrosine 1162/1163 and AKT serine 473 phosphorylation (p) in the adipose tissues of ob/ob mice. The graphs on the right of each blot show the quantification. Data are shown as the mean ± s.e.m. *P < 0.05, **P < 0.01.
Figure 6
Figure 6. Effects of aP2 inhibitor in liver of ob/ob mice
a, aP2 and mal1 protein in the adipose tissue of ob/ob mice treated with vehicle or aP2 inhibitor. For control, the adipose tissue of ob/ob;aP2+/+ (A+) and ob/ob;aP2−/− (A) mice was used. b, Haematoxylin and eosin staining of the liver of ob/ob mice treated with vehicle or aP2 inhibitor. Scale bar, 200 μm. c–f, Triglyceride (TG) content (c) and mRNA expression of Scd1 (d), Fasn (e), and Acaca (f) in the liver of ob/ob mice treated with vehicle (n = 6) or aP2 inhibitor (n = 6). g, JNK1 activity in the liver of ob/ob mice treated with vehicle or aP2 inhibitor. The graph below the blot shows quantification. h, Insulin-stimulated IRβ tyrosine 1162/1163 and AKT serine 473 phosphorylation in the liver tissues of ob/ob mice treated with vehicle or aP2 inhibitor. The graphs demonstrate the quantification of phosphorylation of each molecule. Data are shown as the mean ± s.e.m. *P < 0.05.

References

    1. Hotamisligil GS. Inflammation and metabolic disorders. Nature. 2006;444:860–867. - PubMed
    1. Hertzel AV, Bernlohr DA. The mammalian fatty acid-binding protein multigene family: molecular and genetic insights into function. Trends Endocrinol Metab. 2000;11:175–180. - PubMed
    1. Hunt CR, Ro JH, Dobson DE, Min HY, Spiegelman BM. Adipocyte P2 gene: developmental expression and homology of 5′-flanking sequences among fat cell-specific genes. Proc Natl Acad Sci USA. 1986;83:3786–3790. - PMC - PubMed
    1. Melki SA, Abumrad NA. Expression of the adipocyte fatty acid-binding protein in streptozotocin-diabetes: effects of insulin deficiency and supplementation. J Lipid Res. 1993;34:1527–1534. - PubMed
    1. Distel RJ, Robinson GS, Spiegelman BM. Fatty acid regulation of gene expression. Transcriptional and post-transcriptional mechanisms. J Biol Chem. 1992;267:5937–5941. - PubMed

Publication types

MeSH terms