. 2007 May;34(5):1546-55.
doi: 10.1118/1.2717384.

Tomographic digital subtraction angiography for lung perfusion estimation in rodents

Affiliations

Tomographic digital subtraction angiography for lung perfusion estimation in rodents

Cristian T Badea et al. Med Phys. 2007 May.

Abstract

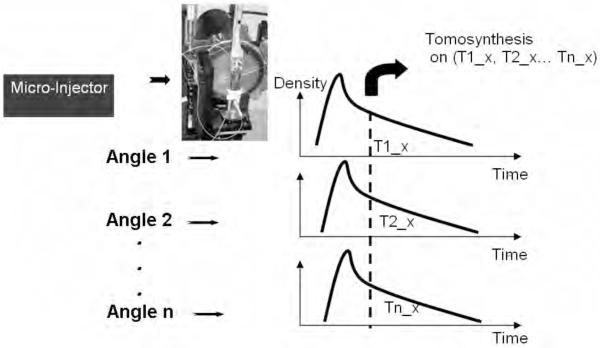
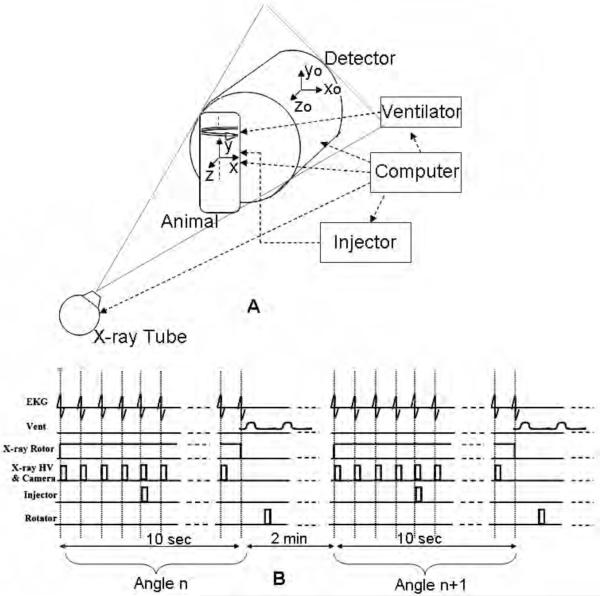
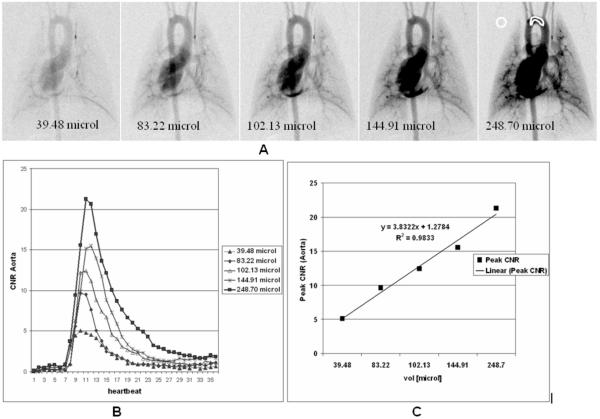
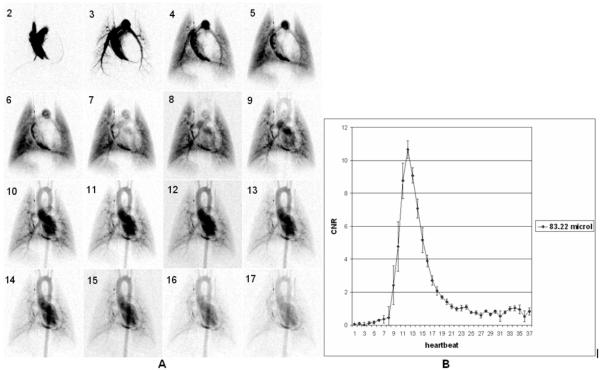
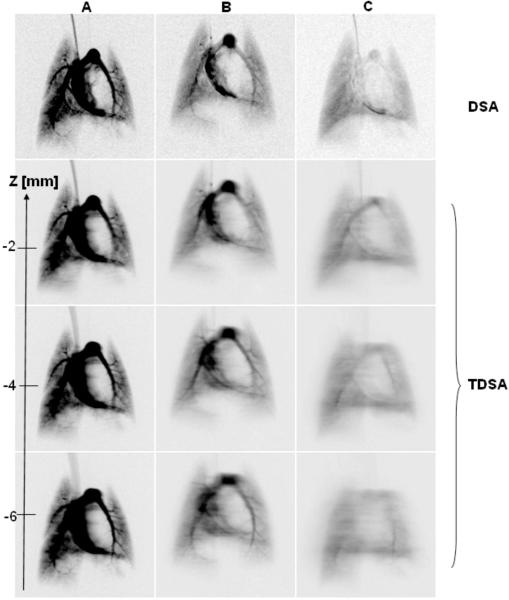
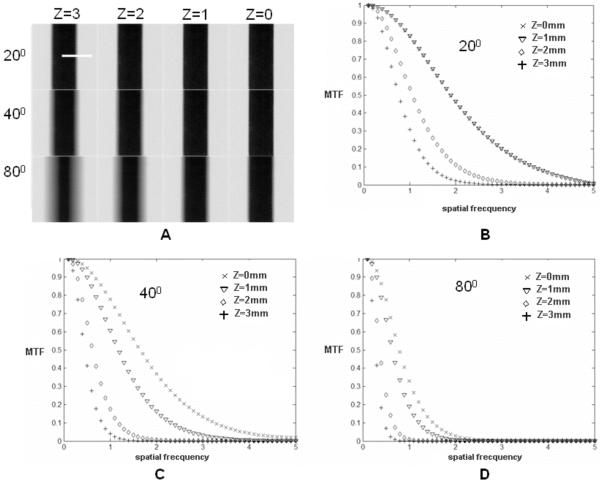
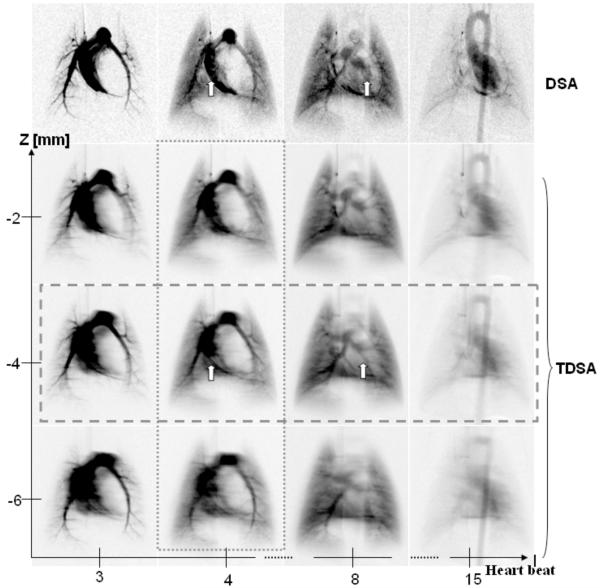
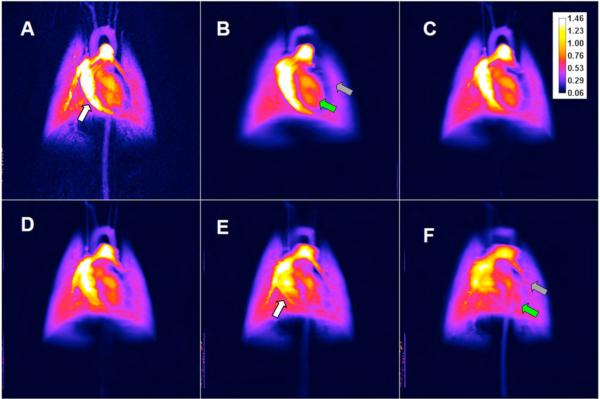
In vivo measurements of perfusion present a challenge to existing small animal imaging techniques such as magnetic resonance microscopy, micro computed tomography, micro positron emission tomography, and microSPECT, due to combined requirements for high spatial and temporal resolution. We demonstrate the use of tomographic digital subtraction angiography (TDSA) for estimation of perfusion in small animals. TDSA augments conventional digital subtraction angiography (DSA) by providing three-dimensional spatial information using tomosynthesis algorithms. TDSA is based on the novel paradigm that the same time density curves can be reproduced in a number of consecutive injections of microL volumes of contrast at a series of different angles of rotation. The capabilities of TDSA are established in studies on lung perfusion in rats. Using an imaging system developed in-house, we acquired data for four-dimensional (4D) imaging with temporal resolution of 140 ms, in-plane spatial resolution of 100 microm, and slice thickness on the order of millimeters. Based on a structured experimental approach, we optimized TDSA imaging providing a good trade-off between slice thickness, the number of injections, contrast to noise, and immunity to artifacts. Both DSA and TDSA images were used to create parametric maps of perfusion. TDSA imaging has potential application in a number of areas where functional perfusion measurements in 4D can provide valuable insight into animal models of disease and response to therapeutics.


Figures

Fig.1
Fig.1
The TDSA principle: the same time density profiles are generated for a ROI during multiple contrast injections at a number of different angles. By selecting the same time points (T1_x T2_x to Tn_x) in the time density profile, a set of consistent projections at different angles can be used for tomographic reconstruction using tomosynthesis.
Fig.2
Fig.2
DSA and TDSA require integration of the X-ray imaging chain ( x-ray tube & detector) with the biological pulse sequencer (gating). (A) shows the schematics of the system during sampling and includes two reference systems i.e. one for the rotating animal or object (x, y, z) and one for the static imaging system (xo, yo, zo). The Biological Pulse Sequence (B) shows suspension of ventilation and image capture on every heartbeat at the QRS complex before and after a single contrast injection. A complete DSA sequence at angle n is acquired in 10 secs of suspended respiration (end expiration). The animal is rotated to the next angle n+1 and ventilated for 2 mins before another DSA sequence is repeated.
Fig.3
Fig.3
Micro-DSA images corresponding to maximum peak enhancement in the aortic arch at 5 different injections volumes (A). ROIs were selected in the aorta and the background and the CNR Aorta is plotted for the different injections (B). The linearity of the imaging system is confirmed by the plot of the CNR versus injection volume for the 5 injections (C).
Fig.4
Fig.4
Sixteen successive images (starting at second heartbeat post injection) from a DSA sequence with 100 ms injection (A). The reproducibility for (n=5) 100 ms injections (volume injected 83.22 μL) is shown by mean and standard error at each heartbeat (B) in a region of the aortic arch (see Fig.3). Note that mean peak value of CNR >10.
Fig.5
Fig.5
Comparison for the fourth heartbeat post injection between DSA images and three TDSA tomographic planes obtained with: A) 20° and 11 injections of 144.91μL each, B) 40° and 21 injections of 83.22 μL each and C) 80° arc and 41 injections of 39.48 μL. The first row shows the corresponding DSA images for a single injection of : 144.91μL (DSA A), 83.22μL (DSA B) and 39.48μL ( DSA C).
Fig.6
Fig.6
A) Four (x-y) TDSA planes at Δz=1mm interval for the thin plate phantom positioned at z=0. The 4 TDSA images were obtained with projections acquired over three reconstruction arcs (20°, 40° and 80°) and the same angular step of 2°. The MTF plots based on the edge profile (see dotted line in A) characterize the filtration along the (x-z) plane for the three arcs 20° (B), 40°(C), 80° (D).
Fig. 7
Fig. 7
A comparison at four selected heartbeats post contrast injection i.e. (3rd, 4th, 8th,15th) between DSA and three TDSA planes at 2 mm interval on z axis. A 40° arc was used for TDSA sampling. Note how the depth discrimination reveals the pulmonary vessels (arrows) at z=-4 mm TDSA slice. These vessels are masked by the superposition of other structures such as the right or left ventricle in the DSA sequence. TDSA allows 4D imaging i.e. both time evolution at heartbeat resolution (horizontal rectangle) and depth discrimination (vertical rectangle).
Fig.8
Fig.8
A comparison between perfusion maps for DSA (A) and TDSA at z=(4, 0,-2,-4,-6) mm (B,C,D,E,F). The white arrows show the pulmonary vessel for which perfusion can be estimated in a TDSA slice (E) but not in DSA (A). Note also how various TDSA planes are different e.g. the LV pointed by the green arrow in (B) does not appear in (F) while the pulmonary artery in (F), shown by the gray arrow, is not in present in (B).

References

    1. Thomas DL. Arterial spin labeling in small animals: Methods and applications to experimental cerebral ischemia. J Magn Reson Imaging. 2005;22:741–744. - PubMed
    1. Benjaminsen IC, Graff BA, Brurberg KG, Rofstad EK. Assessment of tumor blood perfusion by high-resolution dynamic contrast-enhanced mri: A preclinical study of human melanoma xenografts. Magn Reson Med. 2004;52:269–276. - PubMed
    1. Yee SH, Jerabek PA, Fox PT. Non-invasive quantification of cerebral blood flow for rats by micropet imaging of 15o labelled water: The application of a cardiac time-activity curve for the tracer arterial input function. Nucl Med Commun. 2005;26:903–911. - PubMed
    1. Constantinesco A, Choquet P, Monassier L, Israel-Jost V, Mertz L. Assessment of left ventricular perfusion, volumes, and motion in mice using pinhole gated spect. J Nucl Med. 2005;46:1005–1011. - PubMed
    1. Du LY, Lee T-Y, Holdsworth DW. Image quality assessment of a pre-clinical flat-panel volumetric micro-ct scanner. Proc. SPIE Int. Soc. Opt. Eng. 2006:614216.

Publication types

LinkOut - more resources