

Comparative temporal and dose-dependent morphological and transcriptional uterine effects elicited by tamoxifen and ethynylestradiol in immature, ovariectomized mice
- PMID: 17555576
- PMCID: PMC1914052
- DOI: 10.1186/1471-2164-8-151
Comparative temporal and dose-dependent morphological and transcriptional uterine effects elicited by tamoxifen and ethynylestradiol in immature, ovariectomized mice
Abstract
Background: Uterine temporal and dose-dependent histopathologic, morphometric and gene expression responses to the selective estrogen receptor modulator tamoxifen (TAM) were comprehensively examined to further elucidate its estrogen receptor-mediated effects. These results were systematically compared to the effects elicited by the potent estrogen receptor ligand 17alpha-ethynylestradiol (EE) to identify pathways similarly and uniquely modified by each compound.
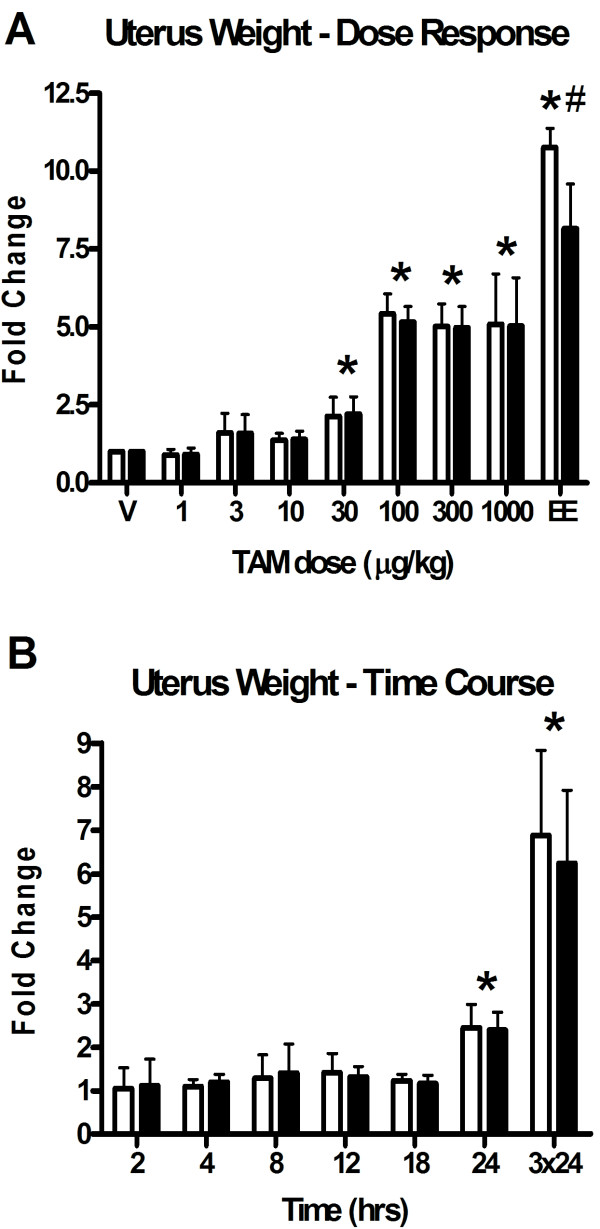
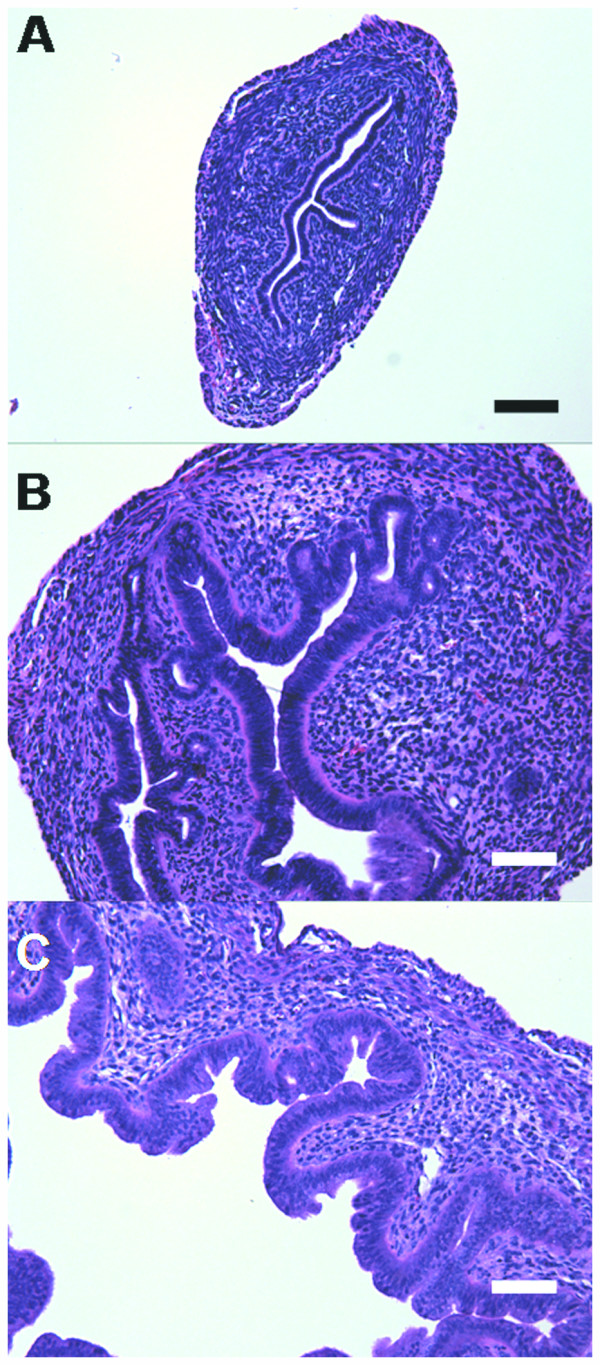
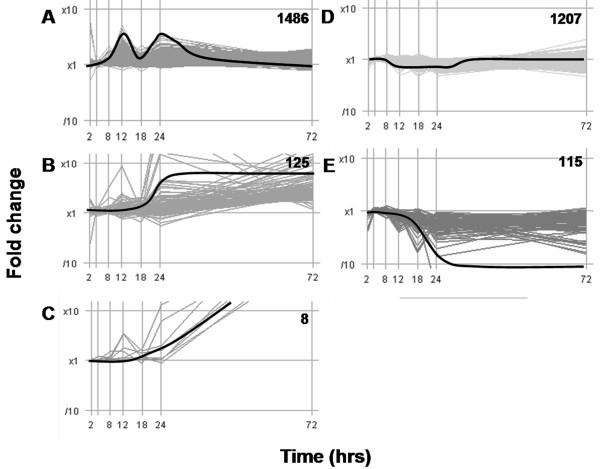
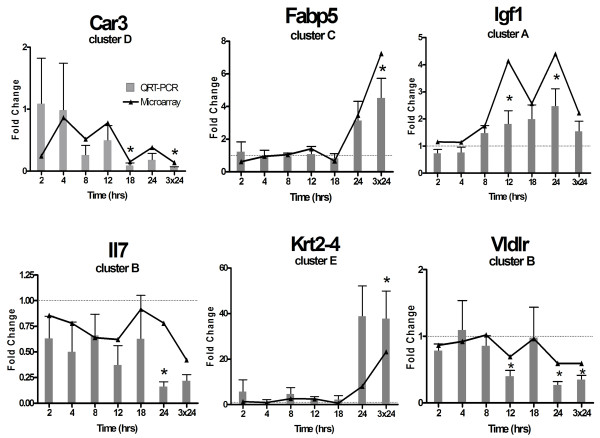
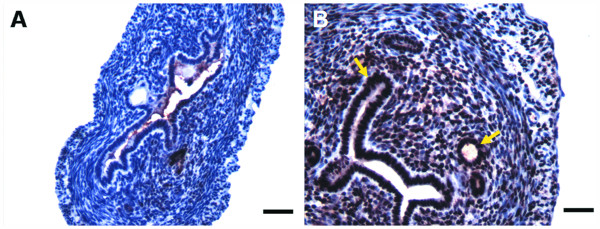
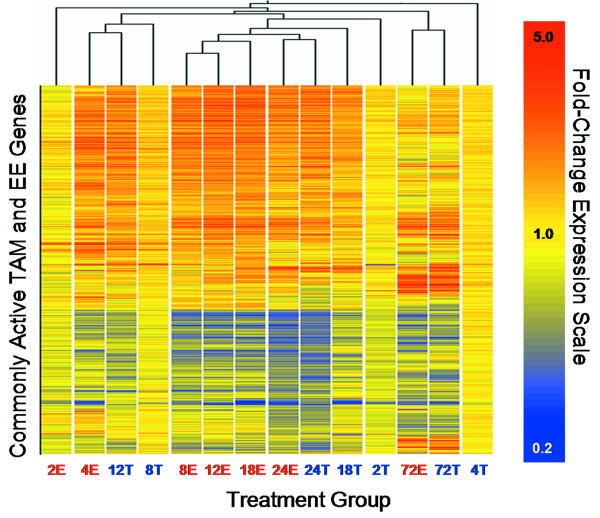
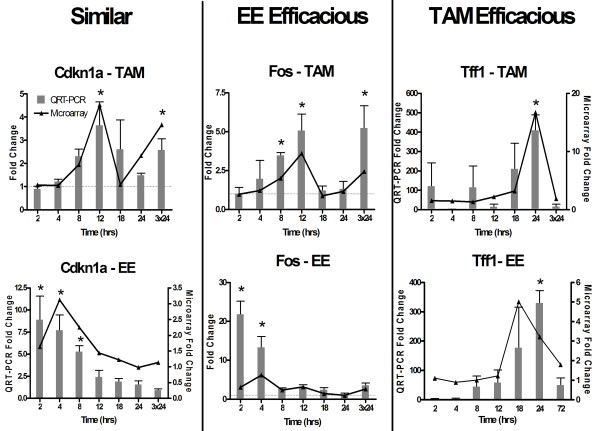
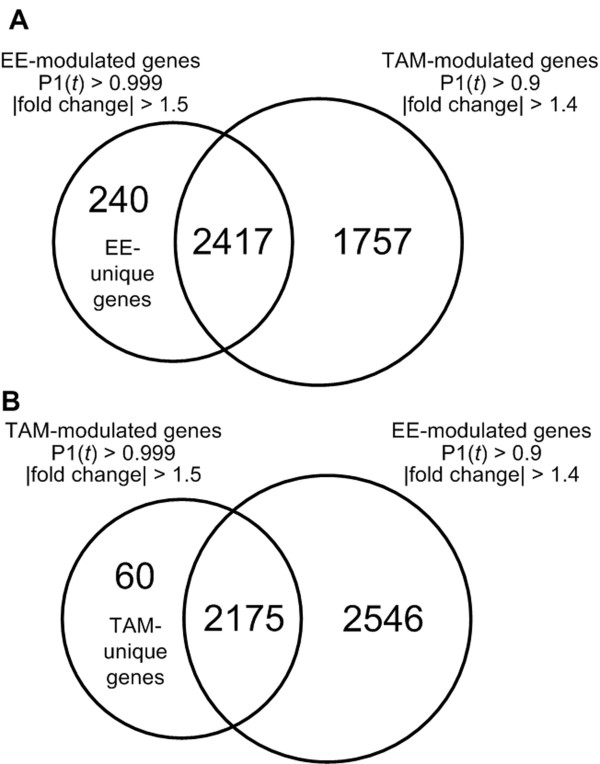
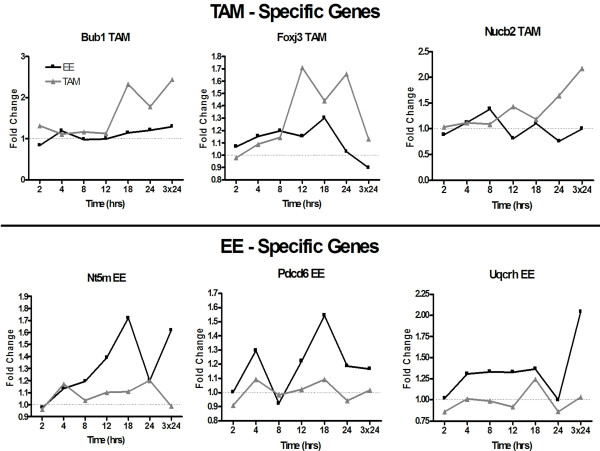
Results: Three daily doses of 100 microg/kg TAM elicited a dose-dependent increase in uterine wet weight (UWW) in immature, ovariectomized C57BL/6 mice at 72 hrs with concurrent increases in luminal epithelial cell height (LECH), luminal circumference and glandular epithelial tubule number. Significant UWW and LECH increases were detected at 24 hrs after a single dose of 100 microg/kg TAM. cDNA microarray analysis identified 2235 differentially expressed genes following a single dose of 100 microg/kg TAM at 2, 4, 8, 12, 18 and 24 hrs, and at 72 hrs after three daily doses (3 x 24 hrs). Functional annotation of differentially expressed genes was associated with cell growth and proliferation, cytoskeletal organization, extracellular matrix modification, nucleotide synthesis, DNA replication, protein synthesis and turnover, lipid metabolism, glycolysis and immunological responses as is expected from the uterotrophic response. Comparative analysis of TAM and EE treatments identified 1209 common, differentially expressed genes, the majority of which exhibited similar profiles despite a temporal delay in TAM elicited responses. However, several conserved and treatment specific responses were identified that are consistent with proliferation (Fos, Cdkn1a, Anapc1), and water imbibition (Slc30a3, Slc30a5) responses elicited by EE.
Conclusion: Overall, TAM and EE share similar gene expression profiles. However, TAM responses exhibit lower efficacy, while responses unique to EE are consistent with the physiological differences elicited between compounds.
Figures
Similar articles
-
Effects of tamoxifen and ethynylestradiol cotreatment on uterine gene expression in immature, ovariectomized mice.J Mol Endocrinol. 2010 Sep;45(3):161-73. doi: 10.1677/JME-09-0158. Epub 2010 Jul 13. J Mol Endocrinol. 2010. PMID: 20628019
-
Temporal- and dose-dependent hepatic gene expression changes in immature ovariectomized mice following exposure to ethynyl estradiol.Carcinogenesis. 2004 Jul;25(7):1277-91. doi: 10.1093/carcin/bgh114. Epub 2004 Feb 19. Carcinogenesis. 2004. PMID: 14976129
-
Gene expression profile induced by 17 alpha-ethynyl estradiol in the prepubertal female reproductive system of the rat.Toxicol Sci. 2003 Apr;72(2):314-30. doi: 10.1093/toxsci/kfg037. Epub 2003 Mar 7. Toxicol Sci. 2003. PMID: 12655037
-
Identification of temporal patterns of gene expression in the uteri of immature, ovariectomized mice following exposure to ethynylestradiol.Physiol Genomics. 2003 Oct 17;15(2):127-41. doi: 10.1152/physiolgenomics.00058.2003. Physiol Genomics. 2003. PMID: 12915738
-
Differential sensitivity of rat uterine growth and epithelium hypertrophy to estrogens and antiestrogens.Proc Soc Exp Biol Med. 1993 Jul;203(3):297-303. doi: 10.3181/00379727-203-43602. Proc Soc Exp Biol Med. 1993. PMID: 8516342
Cited by
-
Cyclopia extracts act as ERα antagonists and ERβ agonists, in vitro and in vivo.PLoS One. 2013 Nov 4;8(11):e79223. doi: 10.1371/journal.pone.0079223. eCollection 2013. PLoS One. 2013. PMID: 24223909 Free PMC article.
-
Tamoxifen suppresses pancreatic β-cell proliferation in mice.PLoS One. 2019 Sep 6;14(9):e0214829. doi: 10.1371/journal.pone.0214829. eCollection 2019. PLoS One. 2019. PMID: 31490929 Free PMC article.
-
Molecular mechanisms of tamoxifen-associated endometrial cancer (Review).Oncol Lett. 2015 Apr;9(4):1495-1501. doi: 10.3892/ol.2015.2962. Epub 2015 Feb 12. Oncol Lett. 2015. PMID: 25788989 Free PMC article.
-
Single nucleotide polymorphisms associated with risk for contralateral breast cancer in the Women's Environment, Cancer, and Radiation Epidemiology (WECARE) Study.Breast Cancer Res. 2011;13(6):R114. doi: 10.1186/bcr3057. Epub 2011 Nov 17. Breast Cancer Res. 2011. PMID: 22087758 Free PMC article.
-
Long-Term Oral Tamoxifen Administration Decreases Brain-Derived Neurotrophic Factor in the Hippocampus of Female Long-Evans Rats.Cancers (Basel). 2024 Mar 31;16(7):1373. doi: 10.3390/cancers16071373. Cancers (Basel). 2024. PMID: 38611051 Free PMC article.
References
-
- Mandlekar S, Hebbar V, Christov K, Kong AN. Pharmacodynamics of tamoxifen and its 4-hydroxy and N-desmethyl metabolites: activation of caspases and induction of apoptosis in rat mammary tumors and in human breast cancer cell lines. Cancer Res. 2000;60:6601–6606. - PubMed
-
- Wijayaratne AL, Nagel SC, Paige LA, Christensen DJ, Norris JD, Fowlkes DM, McDonnell DP. Comparative analyses of mechanistic differences among antiestrogens. Endocrinology. 1999;140:5828–5840. - PubMed
-
- Johnson MD, Zuo H, Lee KH, Trebley JP, Rae JM, Weatherman RV, Desta Z, Flockhart DA, Skaar TC. Pharmacological characterization of 4-hydroxy-N-desmethyl tamoxifen, a novel active metabolite of tamoxifen. Breast Cancer Res Treat. 2004;85:151–159. - PubMed
-
- Fisher DE. Apoptosis in cancer therapy: crossing the threshold. Cell. 1994;78:539–542. - PubMed
Publication types
MeSH terms
Substances
Grants and funding
LinkOut - more resources
Full Text Sources
