. 2007 Jul 27;370(5):925-38.
doi: 10.1016/j.jmb.2007.05.027. Epub 2007 May 18.

The rate of TRAP binding to RNA is crucial for transcription attenuation control of the B. subtilis trp operon

Affiliations

The rate of TRAP binding to RNA is crucial for transcription attenuation control of the B. subtilis trp operon

Maria V Barbolina et al. J Mol Biol. .

Abstract

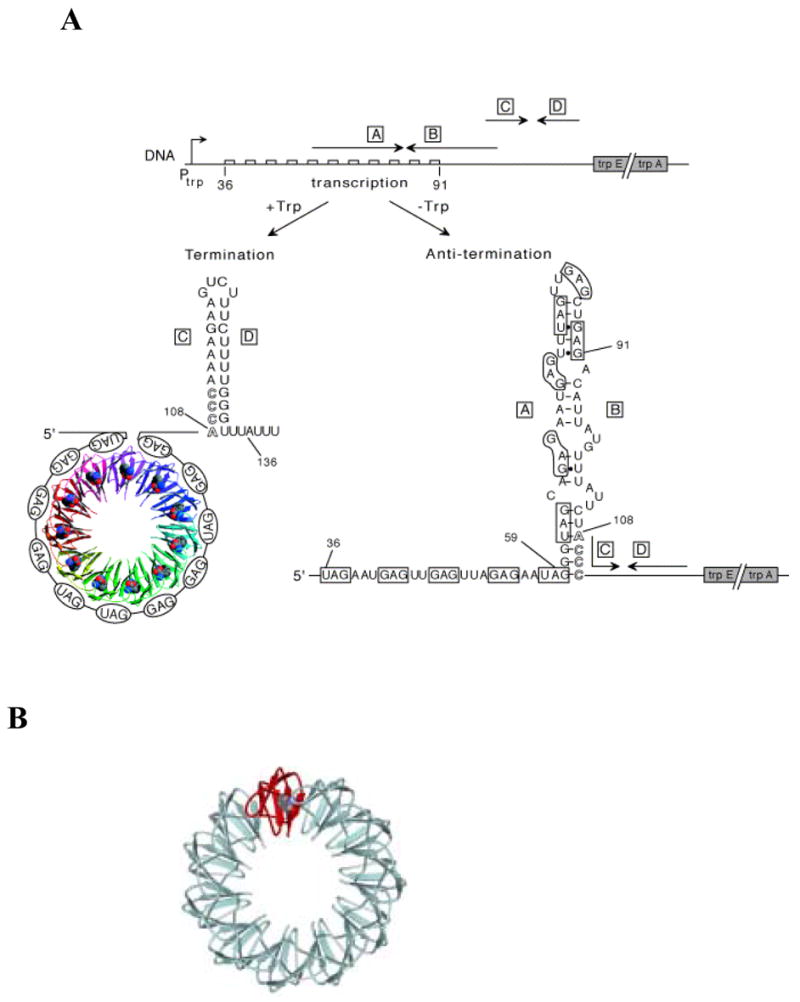
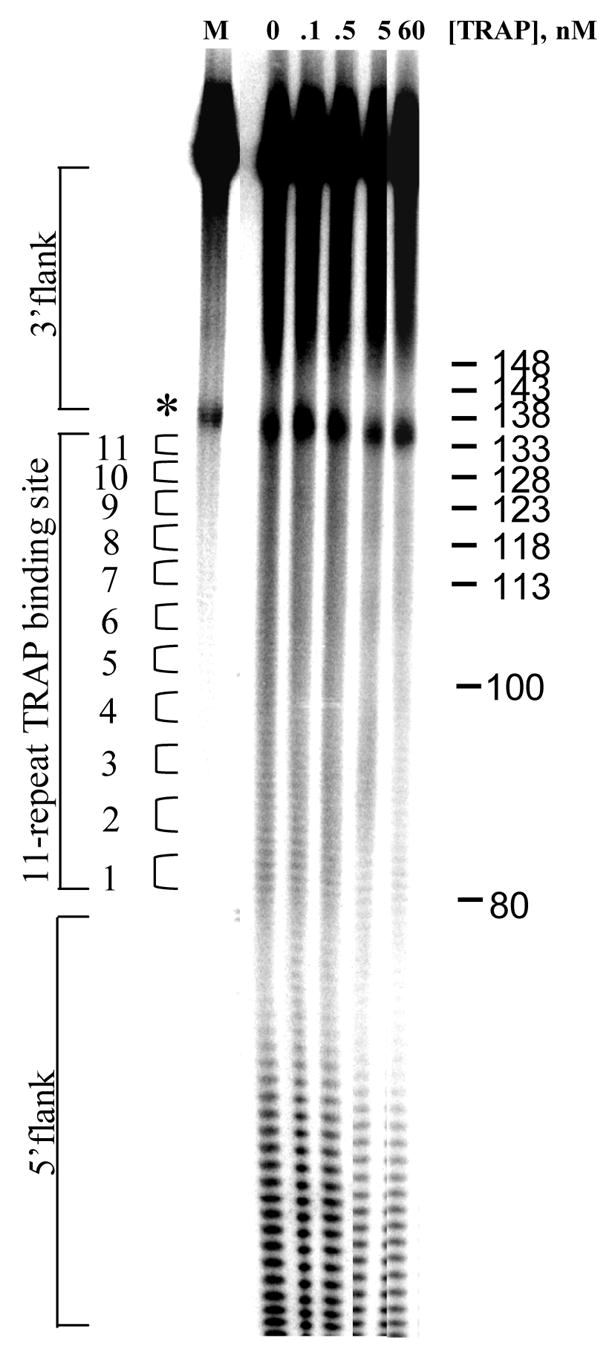
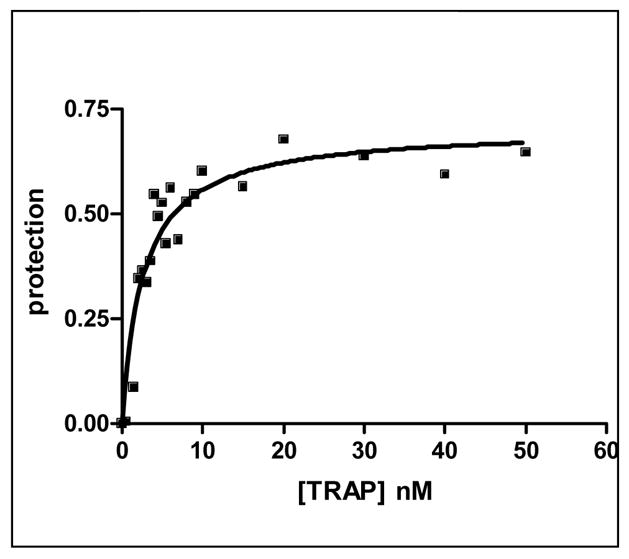
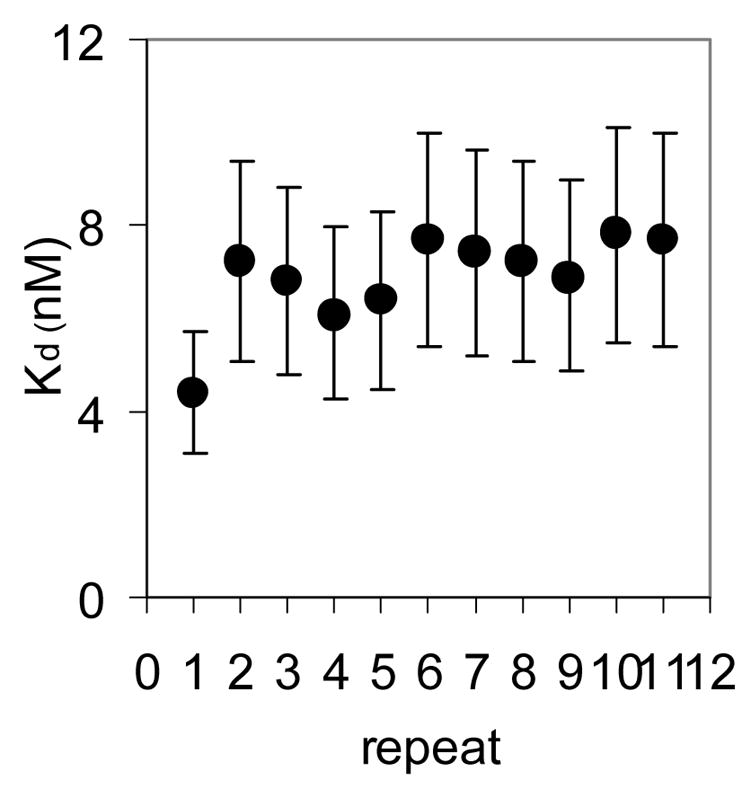
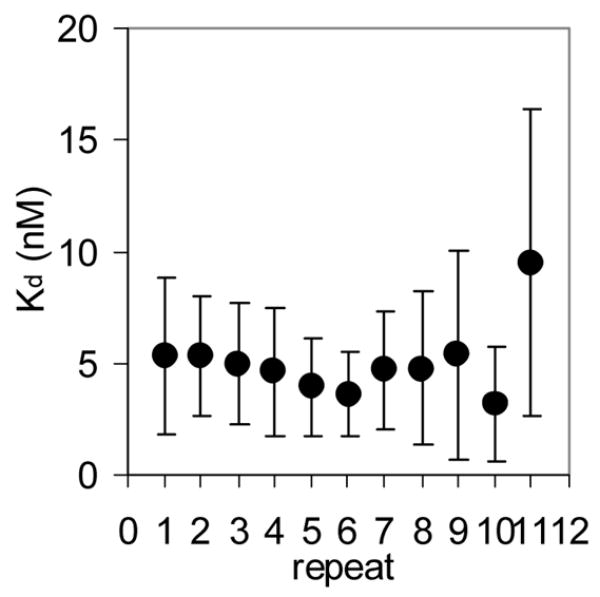
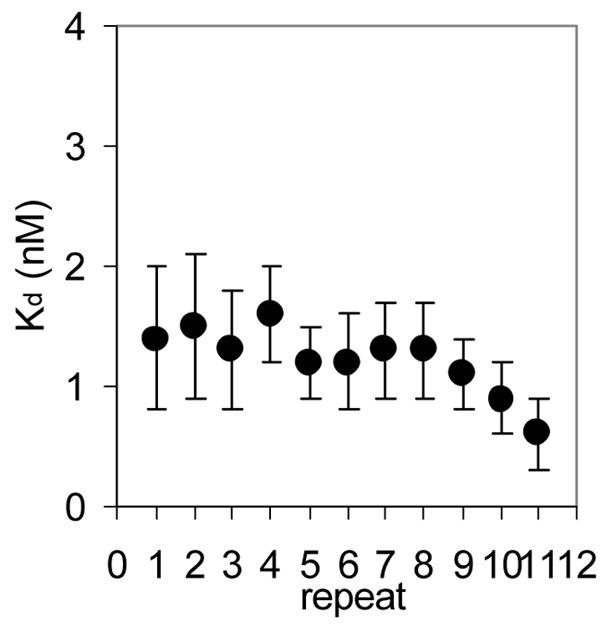
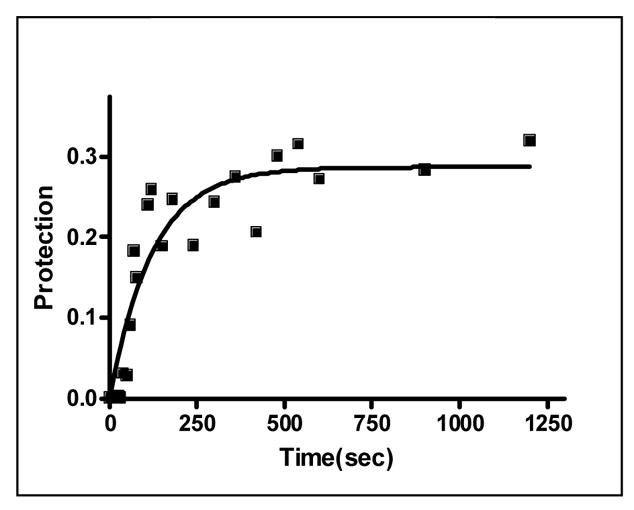
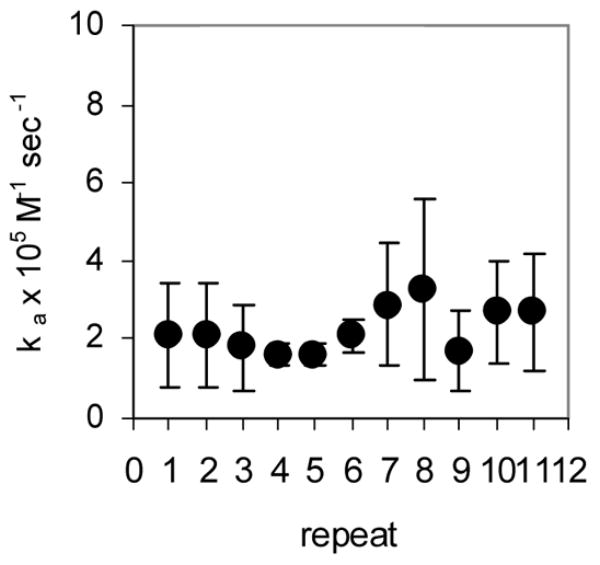
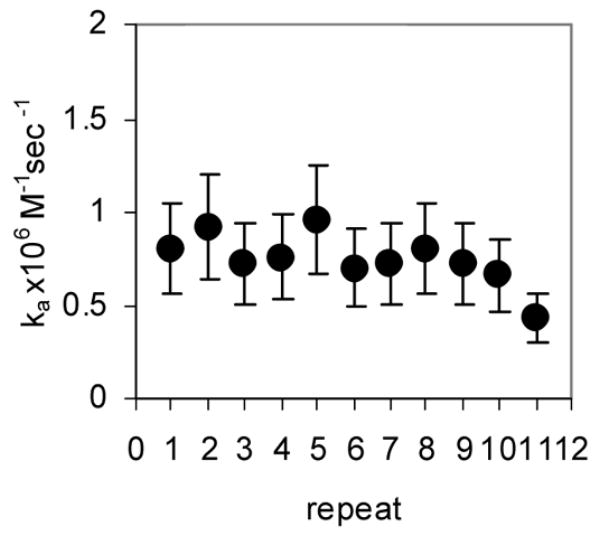
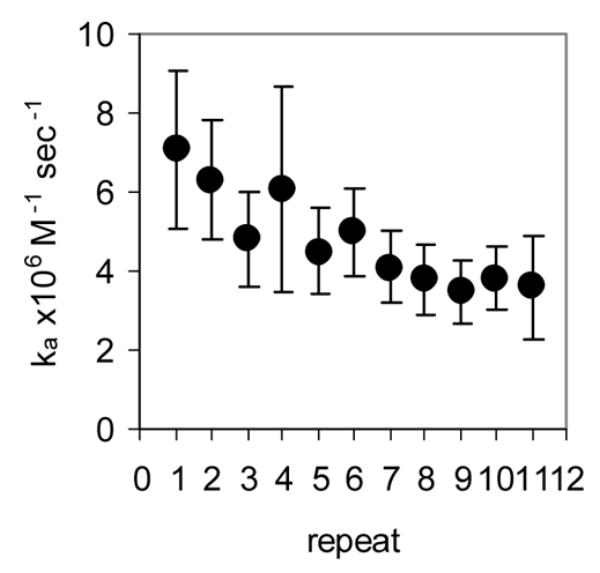
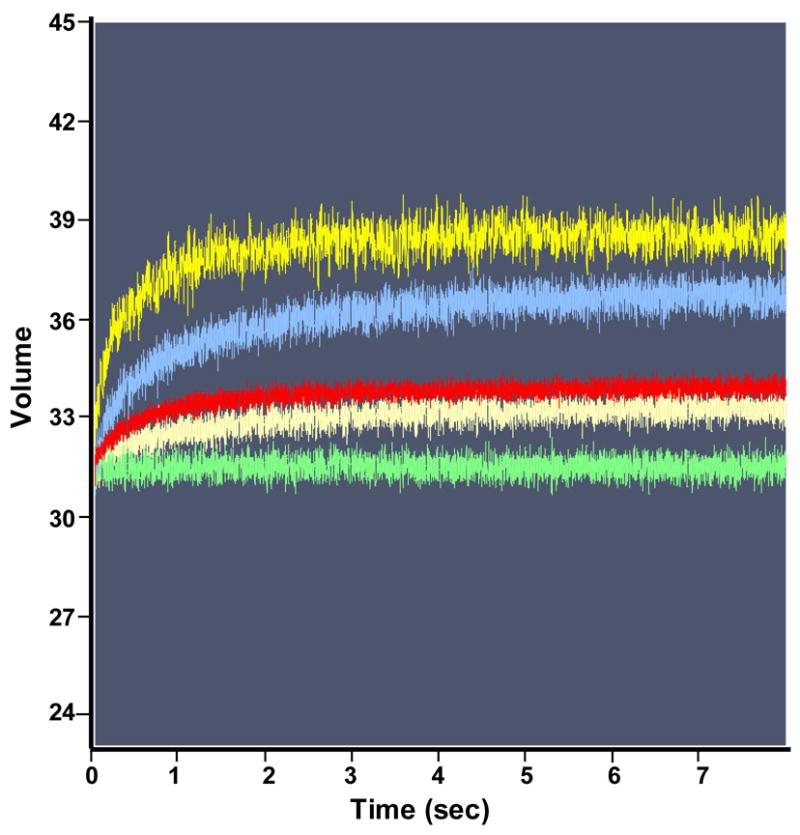
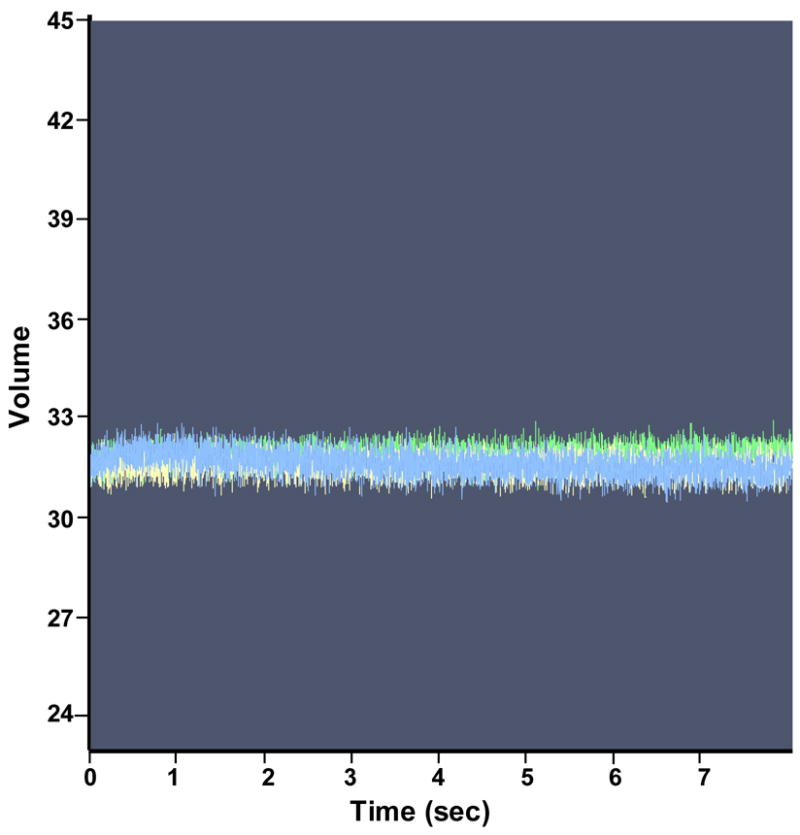
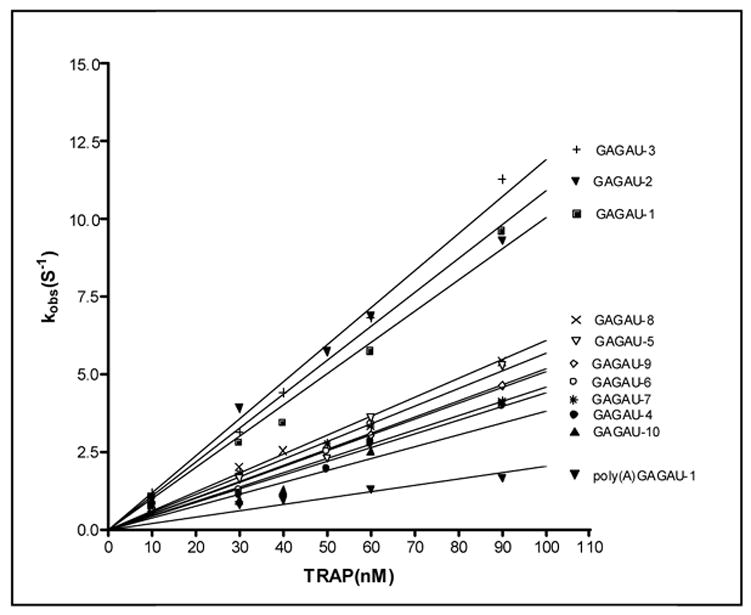
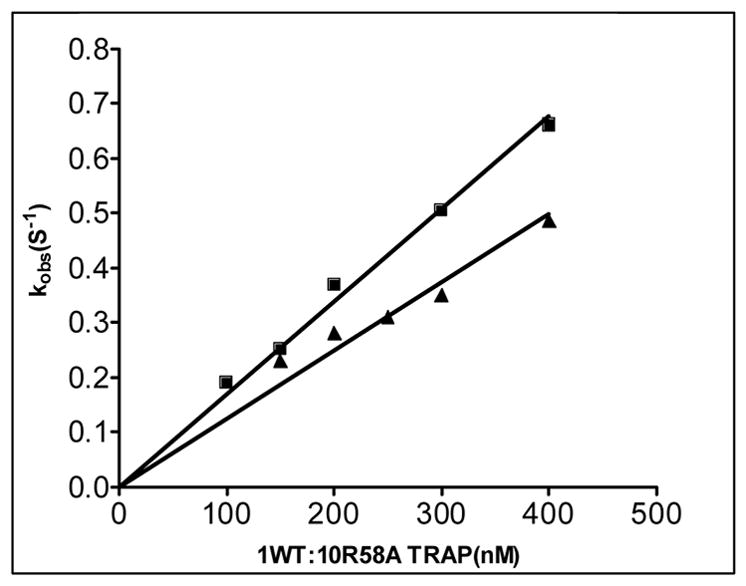
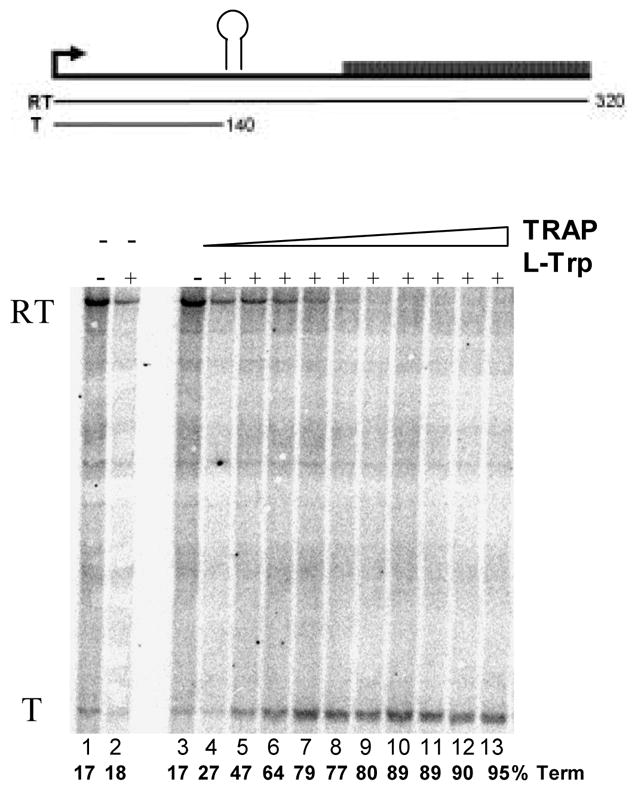
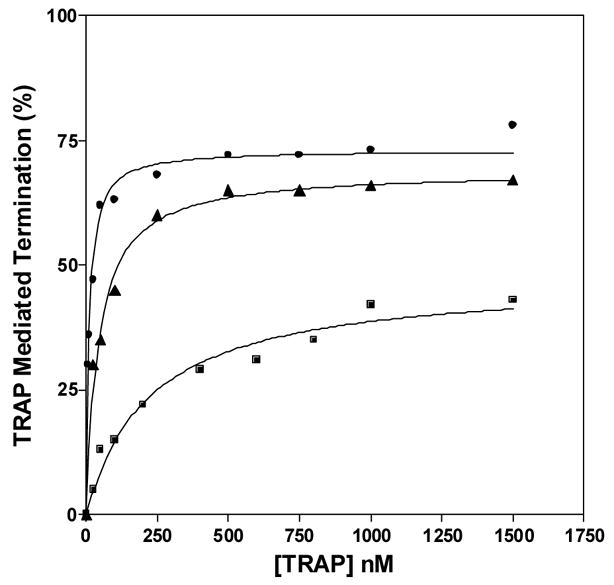
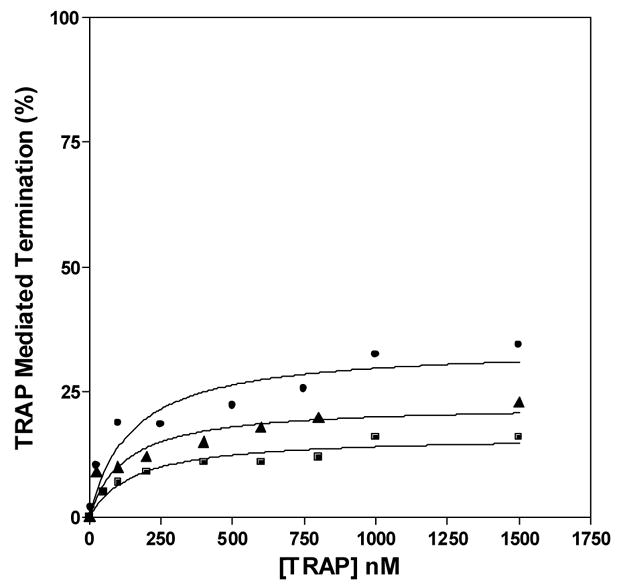
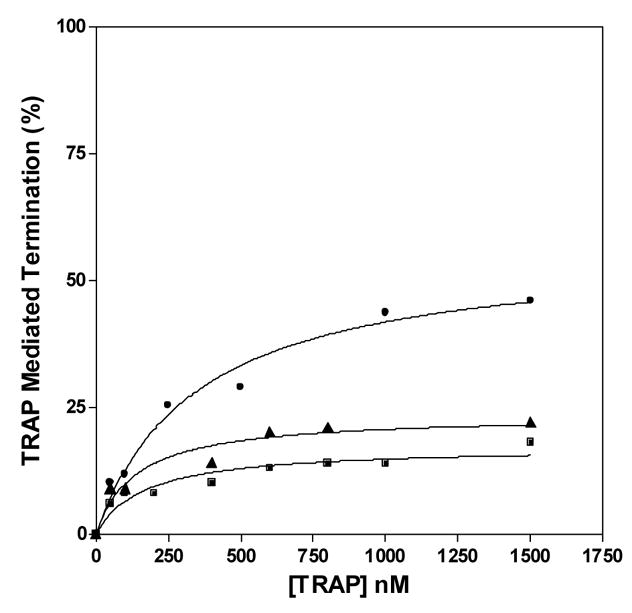
The trp RNA-binding attenuation protein (TRAP) regulates expression of the tryptophan biosynthetic and transport genes in Bacillus subtilis in response to changes in the levels of intracellular tryptophan. Transcription of the trpEDCFBA operon is controlled by an attenuation mechanism involving two overlapping RNA secondary structures in the 5' leader region of the trp transcript; TRAP binding promotes formation of a transcription terminator structure that halts transcription prior to the structural genes. TRAP consists of 11 identical subunits and is activated to bind RNA by binding up to 11 molecules of L-tryptophan. The TRAP binding site in the leader region of the trp operon mRNA consists of 11 (G/U)AG repeats. We examined the importance of the rate of TRAP binding to RNA for the transcription attenuation mechanism. We compared the properties of two types of TRAP 11-mers: homo-11-mers composed of 11 wild-type subunits, and hetero-11-mers with only one wild-type subunit and ten mutant subunits defective in binding either RNA or tryptophan. The hetero-11-mers bound RNA with only slightly diminished equilibrium binding affinity but with slower on-rates as compared to WT TRAP. The hetero-11-mers showed significantly decreased ability to induce transcription termination in the trp leader region when examined using an in vitro attenuation system. Together these results indicate that the rate of TRAP binding to RNA is a crucial factor in TRAP's ability to control attenuation.


Figures

Figure 1
Figure 1
(A) Model of transcription attenuation of the B. subtilis trp operon. The large boxed letters designate the complementary strands of the terminator and antiterminator RNA structures. The TRAP protein is shown as a ribbon diagram with each of the 11 subunits as a different color and the bound tryptophan molecules shown as Van der Waals spheres. The bound RNA is shown wrapping around the TRAP protein. The GAG and UAG repeats involved in TRAP binding are shown in ovals and are also outlined in the sequence of the antiterminator structure. Numbers indicate the residue positions relative to the start of transcription. Nucleotides 108–111 overlap between the antiterminator and terminator structures and are shown as outlined letters. (B). Schematic representation of the (T25A)10WT1 and (R58A)10WT1 hetero-11-mers TRAP used in this study. The wild-type subunit is shown in red and mutant subunits are represented in cyan.
Figure 2
Figure 2
(A) Mung Bean nuclease footprint of (T25A)10WT1 TRAP binding to GAGAU11 RNA (5 pM). The concentration of TRAP was increased from 0 to 60 nM (from the left to the right, lanes marked 0–60). The lane marked “m” is mock-treated control. The position of the TRAP binding site is indicated with a bracket on the left side of the gel with eleven vertical brackets indicating the positions of individual GAG repeats, numbered from the 5′ end. The 5′ flanking and 3′ flanking sequences preceding and following the TRAP binding site are indicated. Positions of MW size markers that were generated by a partial RNase T1 digest of the DNA/RNA chimera “ElevenRiboG”, are shown on the right side of the gel. Note that only several representative concentrations of TRAP are shown of the many that were used to generate binding curves (B) Equilibrium binding curve for (T25A)11WT1 hetero-11-mer TRAP binding to (GAGAU)11polyA RNA. Data are the average of seven experiments with standard errors of < 7% of the mean. (C–E) Kd values for TRAP binding to individual repeats numbered 1 to 11 starting at the 5′ most repeat in each binding site in (GAGAU)11polyA RNA determined by protection from Mung Bean nuclease; (T25A)10WT1 TRAP (C), (R58A)10WT TRAP (D), WT TRAP (E). Data for WT TRAP were published previously and are shown here for comparison.
Figure 2
Figure 2
(A) Mung Bean nuclease footprint of (T25A)10WT1 TRAP binding to GAGAU11 RNA (5 pM). The concentration of TRAP was increased from 0 to 60 nM (from the left to the right, lanes marked 0–60). The lane marked “m” is mock-treated control. The position of the TRAP binding site is indicated with a bracket on the left side of the gel with eleven vertical brackets indicating the positions of individual GAG repeats, numbered from the 5′ end. The 5′ flanking and 3′ flanking sequences preceding and following the TRAP binding site are indicated. Positions of MW size markers that were generated by a partial RNase T1 digest of the DNA/RNA chimera “ElevenRiboG”, are shown on the right side of the gel. Note that only several representative concentrations of TRAP are shown of the many that were used to generate binding curves (B) Equilibrium binding curve for (T25A)11WT1 hetero-11-mer TRAP binding to (GAGAU)11polyA RNA. Data are the average of seven experiments with standard errors of < 7% of the mean. (C–E) Kd values for TRAP binding to individual repeats numbered 1 to 11 starting at the 5′ most repeat in each binding site in (GAGAU)11polyA RNA determined by protection from Mung Bean nuclease; (T25A)10WT1 TRAP (C), (R58A)10WT TRAP (D), WT TRAP (E). Data for WT TRAP were published previously and are shown here for comparison.
Figure 3
Figure 3
Kinetic analysis of WT TRAP and hetero-11-mers binding to RNA (A) Kinetic binding curve for (T25A)10WT1 TRAP binding to (GAGAU)11polyA RNA. Data are the average of four experiments with standard errors of < 7% of the mean. Association constants (ka) for (R58A)10WT1 (B), (T25A)10WT1 (C), WT (D) TRAP binding to individual repeats in GAGAU11 RNA. Repeats are numbered 1 to 11 from the 5′ end of the binding site. Data for WT TRAP were published previously and are shown here for comparison.
Figure 3
Figure 3
Kinetic analysis of WT TRAP and hetero-11-mers binding to RNA (A) Kinetic binding curve for (T25A)10WT1 TRAP binding to (GAGAU)11polyA RNA. Data are the average of four experiments with standard errors of < 7% of the mean. Association constants (ka) for (R58A)10WT1 (B), (T25A)10WT1 (C), WT (D) TRAP binding to individual repeats in GAGAU11 RNA. Repeats are numbered 1 to 11 from the 5′ end of the binding site. Data for WT TRAP were published previously and are shown here for comparison.
Figure 4
Figure 4
Pre-steady state kinetics of wild type TRAP binding to GAGAU-1 RNA analyzed by stopped-flow fluorescence. (A) Changes in fluorescence after addition of TRAP: green line 0 nM TRAP; beige line 30 nM TRAP; red line 50 nM TRAP; blue line 60 nM TRAP; yellow line 90 nM TRAP. (B) Stopped-flow fluorescence analysis of TRAP binding to poly(A)(U)(GAGAA)10GAG RNA line colors are the same as indicated above. (C) Plot of the dependence of observed rate constants (kobs) on the concentration of WT TRAP binding to (GAGAA)11 RNA labeled with Fluorescein-10-U in 10 different positions after individual GAG-repeats. The number in the designation of the RNA indicates the location of the GAG repeat that contains a labeled U residue in the spacer for example GAGAU-1 contains the U residue in the spacer region following the first GAG repeat. GAGAU-1 (■); GAGAU-2 (▼); GAGAU-3 (+); GAGAU-4 (●); GAGAU-5 (▼); GAGAU-6 (○); GAGAU-7 (*); GAGAU-8 (×); GAGAU-9(◇); GAGAU-10 (▲) (D) Plot of the dependence of the observed rate constants (kobs) for on concentration of TRAP in the experiment of (R58A)10WT1 binding to (GAGAA)11 RNA labeled with Fluoroscein-10-U after first or tenth GAG-repeats GAGAU-1 (■); GAGAU-10 (▲).
Figure 4
Figure 4
Pre-steady state kinetics of wild type TRAP binding to GAGAU-1 RNA analyzed by stopped-flow fluorescence. (A) Changes in fluorescence after addition of TRAP: green line 0 nM TRAP; beige line 30 nM TRAP; red line 50 nM TRAP; blue line 60 nM TRAP; yellow line 90 nM TRAP. (B) Stopped-flow fluorescence analysis of TRAP binding to poly(A)(U)(GAGAA)10GAG RNA line colors are the same as indicated above. (C) Plot of the dependence of observed rate constants (kobs) on the concentration of WT TRAP binding to (GAGAA)11 RNA labeled with Fluorescein-10-U in 10 different positions after individual GAG-repeats. The number in the designation of the RNA indicates the location of the GAG repeat that contains a labeled U residue in the spacer for example GAGAU-1 contains the U residue in the spacer region following the first GAG repeat. GAGAU-1 (■); GAGAU-2 (▼); GAGAU-3 (+); GAGAU-4 (●); GAGAU-5 (▼); GAGAU-6 (○); GAGAU-7 (*); GAGAU-8 (×); GAGAU-9(◇); GAGAU-10 (▲) (D) Plot of the dependence of the observed rate constants (kobs) for on concentration of TRAP in the experiment of (R58A)10WT1 binding to (GAGAA)11 RNA labeled with Fluoroscein-10-U after first or tenth GAG-repeats GAGAU-1 (■); GAGAU-10 (▲).
Figure 5
Figure 5
In vitro transcription assay of TRAP-mediated transcription termination in the trp leader region. (A) 8% polyacrylamide-8M urea gel of the products of in vitro transcription of the trp leader region with B. subtilis RNAP in the absence and presence of WT TRAP with 5 μM nucleotide triphosphates. Positions of read-through (RT; 318 nt) and terminated (T; 140 nt) transcripts are indicated. Transcription reactions were carried out in the absence (−) or presence (+) of 1 mM L-Trp and/or TRAP. The triangle above the gel indicates increasing TRAP concentration from 50 to 1500 nM. The schematic diagram above the gel represents the transcription template with the trp promoter, regulatory region and start of the trpE gene. The stem-loop structure above indicates the position of the transcription terminator (attenuator) in the leader region. The lines below indicate the two potential transcripts. (B–D) Plots of the TRAP-mediated increase in termination at the trp attenuator calculated as the amount of terminated transcript divided by the sum of amounts of terminated and read-through transcripts. Transcription assays were performed at 5 μM (●), 50 μM (▲), and 400 μM (■) nucleotide triphosphates. (B) WT TRAP; (C) (T25A)10WT1; (D) (R58A)10WT1
Figure 5
Figure 5
In vitro transcription assay of TRAP-mediated transcription termination in the trp leader region. (A) 8% polyacrylamide-8M urea gel of the products of in vitro transcription of the trp leader region with B. subtilis RNAP in the absence and presence of WT TRAP with 5 μM nucleotide triphosphates. Positions of read-through (RT; 318 nt) and terminated (T; 140 nt) transcripts are indicated. Transcription reactions were carried out in the absence (−) or presence (+) of 1 mM L-Trp and/or TRAP. The triangle above the gel indicates increasing TRAP concentration from 50 to 1500 nM. The schematic diagram above the gel represents the transcription template with the trp promoter, regulatory region and start of the trpE gene. The stem-loop structure above indicates the position of the transcription terminator (attenuator) in the leader region. The lines below indicate the two potential transcripts. (B–D) Plots of the TRAP-mediated increase in termination at the trp attenuator calculated as the amount of terminated transcript divided by the sum of amounts of terminated and read-through transcripts. Transcription assays were performed at 5 μM (●), 50 μM (▲), and 400 μM (■) nucleotide triphosphates. (B) WT TRAP; (C) (T25A)10WT1; (D) (R58A)10WT1
Figure 6
Figure 6
TRAP subunit mixing in vivo. Bar graph showing the effects of expressing K56A TRAP subunits on regulation of a trpE-lacZ fusion in CYBS12 B. subtilis, which expresses wild-type TRAP subunits from the chromosomal mtrB gene. Units of β-galactosidase are plotted for each strain under the growth conditions indicated below the graph. Black bars are for CYBS12 in the absence or presence of the empty E. coli/B. subtilis shuttle plasmid pDG148. Grey bars are for CYBS12 transformed with pYC1, which expresses K56A TRAP from the IPTG-inducible spac promoter. Levels of IPTG added to the growth medium are shown below the bars.

References

    1. Babitzke P, Gollnick P. Posttranscriptional Initiation Control of Tryptophan Metabolism in Bacillus subtilis by the trp RNA-Binding Attenuation Protein (TRAP), anti-TRAP, and RNA Structure. J Bacteriol. 2001;183:5795–5802. - PMC - PubMed
    1. Gollnick P, Babitzke P, Antson A, Yanofsky C. Complexity in Regulation of Tryptophan Biosynthesis in Bacillus subtilis. Annu Rev Genet 2004 - PubMed
    1. Gollnick P, Babitzke P. Transcription attenuation. Biochim Biophys Acta. 2002;1577:240–250. - PubMed
    1. Merino E, Babitzke P, Yanofsky C. trp RNA-binding attenuation protein (TRAP)-trp leader RNA interactions mediate translational as well as transcriptional regulation of the Bacillus subtilis trp operon. J Bacteriol. 1995;177:6362–6370. - PMC - PubMed
    1. Kuroda MI, Henner D, Yanofsky C. cis-Acting sites in the transcript of the Bacillus subtilis trp operon regulate expression of the operon. J Bacteriol. 1988;170:3080–3088. - PMC - PubMed

Publication types

MeSH terms

LinkOut - more resources