. 2007 Nov;145(3):814-30.
doi: 10.1104/pp.107.099895. Epub 2007 Jun 7.

STRESS RESPONSE SUPPRESSOR1 and STRESS RESPONSE SUPPRESSOR2, two DEAD-box RNA helicases that attenuate Arabidopsis responses to multiple abiotic stresses

Affiliations

STRESS RESPONSE SUPPRESSOR1 and STRESS RESPONSE SUPPRESSOR2, two DEAD-box RNA helicases that attenuate Arabidopsis responses to multiple abiotic stresses

Pragya Kant et al. Plant Physiol. 2007 Nov.

Abstract

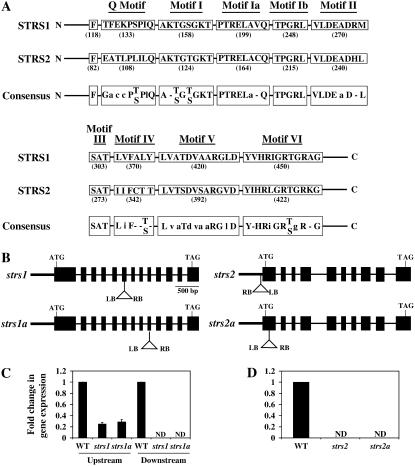
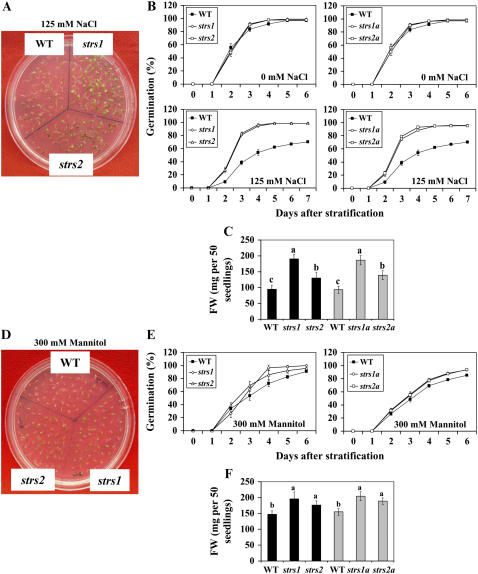
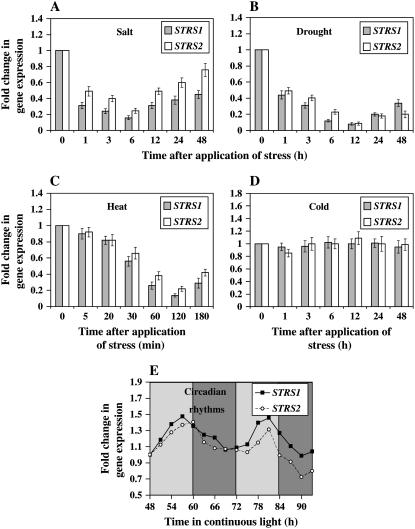
Two genes encoding Arabidopsis (Arabidopsis thaliana) DEAD-box RNA helicases were identified in a functional genomics screen as being down-regulated by multiple abiotic stresses. Mutations in either gene caused increased tolerance to salt, osmotic, and heat stresses, suggesting that the helicases suppress responses to abiotic stress. The genes were therefore designated STRESS RESPONSE SUPPRESSOR1 (STRS1; At1g31970) and STRS2 (At5g08620). In the strs mutants, salt, osmotic, and cold stresses induced enhanced expression of genes encoding the transcriptional activators DREB1A/CBF3 and DREB2A and a downstream DREB target gene, RD29A. Under heat stress, the strs mutants exhibited enhanced expression of the heat shock transcription factor genes, HSF4 and HSF7, and the downstream gene HEAT SHOCK PROTEIN101. Germination of mutant seed was hyposensitive to the phytohormone abscisic acid (ABA), but mutants showed up-regulated expression of genes encoding ABA-dependent stress-responsive transcriptional activators and their downstream targets. In wild-type plants, STRS1 and STRS2 expression was rapidly down-regulated by salt, osmotic, and heat stress, but not cold stress. STRS expression was also reduced by ABA, but salt stress led to reduced STRS expression in both wild-type and ABA-deficient mutant plants. Taken together, our results suggest that STRS1 and STRS2 attenuate the expression of stress-responsive transcriptional activators and function in ABA-dependent and ABA-independent abiotic stress signaling networks.


Figures

Figure 1.
Figure 1.
Arabidopsis STRS1 and STRS2 are DEAD-box RNA helicases whose expression is disrupted in T-DNA insertion mutants. A, Alignment of conserved motifs specific to DEAD-box helicases that are present in STRS1 and STRS2 with the consensus sequences of the DEAD-box family. Numbers in parentheses represent the amino acid position of the first residue in each motif. For the consensus sequences, capital letters denote amino acids that are conserved at least 80%, while lowercase letters denote amino acids that are conserved 50% to 79% (Tanner and Linder, 2001; Rocak and Linder, 2004). B, Scheme of the STRS1 and STRS2 genes. Black boxes represent exons and lines symbolize introns. The position and orientation of the T-DNA insertion is depicted (not to scale). LB, Left border sequence; RB, right border sequence. C and D, Real-time PCR analysis of STRS1 and STRS2 expression, respectively, in wild type and two independent T-DNA insertion mutants for each gene. Relative transcript levels were determined by real-time PCR according to the 2−ΔΔCT method using UBQ10 as an internal control (Livak and Schmittgen, 2001). Gene expression was normalized to the wild-type expression level, which was assigned a value of 1. Data represent the average of three independent experiments ± sd. Upstream, RT-PCR carried out with primers complementary to sequences upstream of the T-DNA insertion; Downstream, RT-PCR carried out with primers complementary to sequences downstream of the T-DNA insertion; ND, not detectable.
Figure 2.
Figure 2.
Altered salt and osmotic stress tolerance of strs1 and strs2 mutants. A, Increased tolerance to salt stress. Seeds were germinated and grown on MS plates with and without 125 mm NaCl. Photographs were taken on the tenth day after stratification. WT, Wild type. B, Percentage of germination of wild type and two independent alleles of strs1 and strs2 on MS plates with and without 125 mm NaCl. Data are mean ± sd (n = 4). Fisher's protected lsd test showed no significant difference in germination percentage of wild type and mutants without NaCl. However, with NaCl, strs1, strs2, strs1a, and strs2a exhibited significantly higher germination percentage than wild type (P ≤ 0.05). C, FW of wild type and two independent alleles of strs1 and strs2 10 d after stratification on MS plates with and without 125 mm NaCl. Data are mean ± sd (n = 4). Bars with different letters indicate significant difference at P ≤ 0.05 (Fisher's protected lsd test). D, Increased tolerance to osmotic stress. Seeds were germinated and grown on MS plates with and without 300 mm mannitol. Photographs were taken on the tenth day after stratification. E, Percentage of germination of wild type and two independent alleles of strs1 and strs2 on MS plates with and without 300 mm mannitol. Data are mean ± sd (n = 4). Fisher's protected lsd test showed no significant difference in germination percentage between wild type and mutants without mannitol. However, with mannitol, strs1 and strs2 exhibited significantly higher germination than wild type at 4 and 5 d after stratification, while strs1a and strs2a exhibited significantly higher germination percentage than wild type at 4, 5, and 6 d after stratification (P ≤ 0.05). F, FW of wild type and two independent alleles of strs1 and strs2 10 d after stratification on MS plates with and without 300 mm mannitol. Data are mean ± sd (n = 4). Bars with different letters indicate significant difference at P ≤ 0.05 (Fisher's protected lsd test).
Figure 3.
Figure 3.
Altered basal and acquired thermotolerance of strs1 and strs2 mutants. A, Basal thermotolerance. Stratified seeds sown on MS plates were exposed to 45°C for 3 h and then allowed to germinate and grow at 22°C. A representative plate is shown 6 d after transfer to 22°C. WT, Wild type; hot1-3, a mutant of HSP101 that is defective in basal and acquired thermotolerance (Hong and Vierling, 2000). B, Quantification of basal thermotolerance by percentage of germination of seeds treated at 45°C for 3 h. The results from two independent alleles of strs1 and strs2 are shown. Data are mean ± sd (n = 3). Fisher's protected lsd test showed that all strs mutant lines exhibited a significantly higher germination percentage than wild type and hot1-3 (P ≤ 0.05). C, Quantification of basal thermotolerance by hypocotyl elongation assay using two independent alleles of strs1 and strs2. Seeds were treated at 45°C for the indicated time periods and allowed to germinate in the dark on vertical plates. Hypocotyl length was measured 6 d after transfer to 22°C. Data are mean ± sd (n = 4). Each replicate consisted of approximately 20 seedlings. Bars with different letters indicate significant difference at P ≤ 0.05 (Fisher's protected lsd test). D, Acquired thermotolerance. Seedlings were grown on vertical plates in the dark for 3 d. Con, Control seedlings maintained at 22°C; PT, pretreatment of 38°C for 90 min; HS, heat stress of 45°C for 2 h; PT + 2, pretreatment followed by 2 h at 22°C and then 45°C for 2 h; PT + 3, pretreatment followed by 2 h at 22°C and then 45°C for 3 h. After heat treatment, seedlings were grown for a further 3 d before measurement of the post-stress increase in hypocotyl length. Data are mean ± sd (n = 4). Each replicate consisted of approximately 15 to 20 seedlings. Bars with different letters indicate significant difference at P ≤ 0.05 (Fisher's protected lsd test).
Figure 4.
Figure 4.
Expression of stress-responsive genes in wild-type and strs mutant plants subjected to salt, drought, and cold treatments. Two-week-old soil-grown plants were exposed to various stress treatments. Relative transcript levels were determined by real-time PCR according to the 2−ΔΔCT method using UBQ10 as an internal control (Livak and Schmittgen, 2001). Gene expression was normalized to the wild-type unstressed expression level, which was assigned a value of 1. Data represent the average of three independent experiments ± sd. A, D, G, J, L, N, and P, Salt treatment; 200 mm NaCl. B, E, H, K, M, O, and Q, Drought treatment; plants were removed from the soil and allowed to dry under 60% humidity. C, F, I, and R, Cold treatment; 4°C.
Figure 5.
Figure 5.
Expression of heat stress-responsive genes in wild type and strs1 and strs2 mutants. A to D, Two-week-old plants were exposed to 40°C for the indicated time periods. Relative transcript levels were determined by real-time PCR according to the 2−ΔΔCT method using UBQ10 as an internal control (Livak and Schmittgen, 2001). Gene expression was normalized to the wild-type unstressed expression level, which was assigned a value of 1. Data represent the average of three independent experiments ± sd.
Figure 6.
Figure 6.
ABA-responsive gene expression and ABA sensitivity in wild type and strs1 and strs2 mutants. Seedlings were grown on vertical MS plates for 4 d after germination and then transferred to fresh treatment plates. Relative transcript levels were determined by real-time PCR according to the 2−ΔΔCT method using UBQ10 as an internal control (Livak and Schmittgen, 2001). Gene expression was normalized to the wild-type control expression level, which was assigned a value of 1. Data represent the average of four independent experiments ± sd (n = 4). A, Expression of RD26 in wild-type and strs mutant seedlings transferred to MS plates with 100 μm ABA. B, Expression of RD26 in wild-type and strs mutant seedlings transferred to MS plates without ABA. C, Expression of STRS1 and STRS2 in wild-type seedlings transferred to MS plates with 100 μm ABA. D, Expression of STRS1 and STRS2 in wild-type seedlings transferred to MS plates with 300 mm NaCl. E, Expression of STRS1 and STRS2 in aba2-1 (ABA-deficient) mutant seedlings transferred to MS plates with 300 mm NaCl. F, Percentage of germination of wild-type and strs1 and strs2 mutant seedlings after 6 d incubation on MS media containing different concentrations of ABA. Data are mean ± sd (n = 3). Fisher's protected lsd test showed that all strs mutant lines exhibited a significantly higher germination percentage than wild type upon exposure to ABA (P ≤ 0.01).
Figure 7.
Figure 7.
Stress-responsive and circadian clock-controlled expression of STRS1 and STRS2. Two-week-old wild-type soil-grown plants were exposed to various stress treatments. Relative transcript levels were determined by real-time PCR according to the 2−ΔΔCT method using UBQ10 as an internal control (Livak and Schmittgen, 2001). Expression was normalized to the unstressed expression level of the respective gene, which was assigned a value of 1. Data represent the average of three independent experiments ± sd. A, Salt treatment; 200 mm NaCl. B, Drought treatment; plants were removed from the soil and allowed to dry under 60% humidity. C, Heat treatment; 40°C. D, Cold treatment; 4°C. E, Circadian clock control; 7-d-old wild-type seedlings were entrained in a 12-h-light:12-h-dark photoperiod for 4 d and then released into continuous light. Data are representative of similar results from two independent experiments. Light and dark shaded bars represent subjective day and subjective night, respectively.
Figure 8.
Figure 8.
A model of the regulation of abiotic stress signaling by STRS1 and STRS2. The STRS proteins attenuate stress-induced expression of upstream transcriptional activators operating in the ABA-independent and ABA-dependent stress signaling subnetworks. The STRS proteins act as regulatory nodes linking the salt/osmotic and heat stress signaling subnetworks, which repress STRS gene expression. ABA signaling might link STRS control of heat, salt, and osmotic stress responses.

Similar articles

Cited by

References

    1. Abe H, Urao T, Ito T, Seki M, Shinozaki K, Yamaguchi-Shinozaki K (2003) Arabidopsis AtMYC2 (bHLH) and AtMYB2 (MYB) function as transcriptional activators in abscisic acid signaling. Plant Cell 15 63–78 - PMC - PubMed
    1. Abe H, Yamaguchi-Shinozaki K, Urao T, Iwasaki T, Hosokawa D, Shinozaki K (1997) Role of Arabidopsis MYC and MYB homologs in drought and abscisic acid-regulated gene expression. Plant Cell 9 1859–1868 - PMC - PubMed
    1. Albrecht V, Weinl S, Blazevic D, D'Angelo C, Batistic O, Kolukisaoglu U, Bock R, Schulz B, Harter K, Kudla J (2003) The calcium sensor CBL1 integrates plant responses to abiotic stresses. Plant J 36 457–470 - PubMed
    1. Alonso JM, Stepanova AN, Leisse TJ, Kim CJ, Chen H, Shinn P, Stevenson DK, Zimmerman J, Barajas P, Cheuk R, et al (2003) Genome-wide insertional mutagenesis of Arabidopsis thaliana. Science 301 653–657 - PubMed
    1. Aubourg S, Kreis M, Lecharny A (1999) The DEAD box RNA helicase family in Arabidopsis thaliana. Nucleic Acids Res 27 628–636 - PMC - PubMed

Publication types

MeSH terms

LinkOut - more resources