. 2007 Aug;144(4):1786-96.
doi: 10.1104/pp.106.094946. Epub 2007 Jun 7.

Exclusion of Na+ via sodium ATPase (PpENA1) ensures normal growth of Physcomitrella patens under moderate salt stress

Affiliations

Exclusion of Na+ via sodium ATPase (PpENA1) ensures normal growth of Physcomitrella patens under moderate salt stress

Christina Lunde et al. Plant Physiol. 2007 Aug.

Abstract

The bryophyte Physcomitrella patens is unlike any other plant identified to date in that it possesses a gene that encodes an ENA-type Na(+)-ATPase. To complement previous work in yeast (Saccharomyces cerevisiae), we determined the importance of having a Na(+)-ATPase in planta by conducting physiological analyses of PpENA1 in Physcomitrella. Expression studies showed that PpENA1 is up-regulated by NaCl and, to a lesser degree, by osmotic stress. Maximal induction is obtained after 8 h at 60 mm NaCl or above. No other abiotic stress tested led to significant increases in PpENA1 expression. In the gametophyte, strong expression was confined to the rhizoids, stem, and the basal part of the leaf. In the protonemata, expression was ubiquitous with a few filaments showing stronger expression. At 100 mm NaCl, wild-type plants were able to maintain a higher K(+)-to-Na(+) ratio than the PpENA1 (ena1) knockout gene, but at higher NaCl concentrations no difference was observed. Although no difference in chlorophyll content was observed between ena1 and wild type at 100 mm NaCl, the impaired Na(+) exclusion in ena1 plants led to an approximately 40% decrease in growth.


Figures
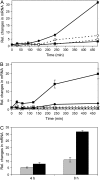
Figure 1.
Figure 1.
Transcription pattern of PpENA1 under abiotic stress. A, Ten-day-old protonemata were exposed to different concentrations of NaCl. Tissue was harvested at different time points and mRNA extracted for qRT-PCR; 5 mm (white square), 10 mm (black square), 30 mm (white circle), and 60 mm (black circle). B, PpENA1 expression in protonemata exposed to different abiotic stresses. Protonemata were either not treated (hatched, white square), or exposed to 100 mm NaCl (black square), UV-B (black, cross), 50 μm ABA (hatched, cross), cold (hatched, white circle), or 50 μm methyl viologen (solid, black circle). C, The level of PpENA1 up-regulation after protonemata were exposed for 4 or 8 h to either 30 mm PEG (gray) or 60 mm NaCl (black), which impose a similar change in the osmotic potential.
Figure 2.
Figure 2.
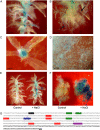
Tissue-specific expression of PpENA1. The PpENA1 promoter (1,451 bp) was fused to a GUS-reporter gene and the construct transformed into Physcomitrella. A, GUS staining of a representative 5-week-old gametophyte grown on standard medium without NaCl, showing GUS staining in the stem and the basal part of the leaves. Bar = 0.4 mm. B, GUS staining of rhizoids from a nonstressed gametophyte. Arrows indicate the strongly stained filaments. Bar = 0.4 mm. C, Cross section of a gametophyte showing staining in the hydroids, cortex, and epidermis. Bar = 0.2 mm. D, Ubiquitous GUS staining in nonstressed protonemata. Bar = 0.4 mm. E, Comparison of GUS staining in two gametophytes originating from the same colony either left untreated or exposed to 100 mm NaCl for 24 h before GUS staining. The staining is significantly stronger, but still confined to the same tissues after salt stress. Bar = 0.6 mm. F, The effect of salt treatment on protonemata. A 10-d-old protonematal colony was divided in two and one-half of the colony was exposed to 100 mm NaCl for 24 h and the other half not treated. The strong GUS staining throughout the tissue is seen after NaCl stress. Bar = 1.5 mm. G, In silico PpENA1-promoter analysis. Putative cis-regulatory elements in the PpENA1 promoter were identified searching PLACE or NSITE-PL. Because the importance of regulatory elements generally decreases with increasing distance from the transcription start site, only the first 500 bp upstream of the putative transcription start site were included in the analysis. Putative GT-1 box (GAAAAA, black), Myb (WAACCA, CTGTTG, green), Myc (CANNTG, red), ABRE (ACGTGGC, blue), and CE-1 coupling elements (TGCCACCGC*, purple) are indicated. Mismatches in the consensus sequence are underlined and elements with an expected mean frequency <0.05 in 500 bp of random DNA sequence are marked with an asterisk. The putative 5′ UTR based on available EST sequences is shown in bold.
Figure 3.
Figure 3.
Generating PpENA1 knockouts by homologous recombination. A, cDNA clone of PpENA1 was restriction enzyme digested at a unique ClaI site and the nptII gene inserted to generate a knockout cassette. B, The transformants were screened by PCR on genomic DNA using a mix of primers specific to PpENA1 (oCL181, oCL182) and nptII (oCL183, oCL184). A 488-bp band is expected in the wild type and a 792-bp band in the transformants where the PpENA1 gene has been replaced by the knockout cassette (ena1). Although all four primers anneal to the PpENA1 knockout cassette, the short fragment will be favored during the PCR. If the selective cassette is inserted in the genome, without replacing the PpENA1 gene, both the 488- and 792-bp PCR fragments will be present. C, PpENA1 mRNA levels. To ensure that PpENA1 was not expressed in the ena1 lines, mixed protonemata and gametophytes from wild type (black line) and ena1 (stippled line) were exposed to 100 mm NaCl and tissue harvested at different time points used for qRT-PCR. PpENA1 expression was normalized against four control genes (see “Materials and Methods”).
Figure 4.
Figure 4.
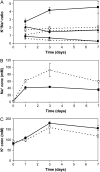
The intracellular K+-to-Na+ ratio of wild-type and ena1 plants exposed to varying NaCl concentrations. A, Five-week-old gametophytes of wild type (black; n = 6) and ena1 (stippled; n = 9) were exposed to 100 (square), 200 (triangle), or 400 mm (circle) NaCl for up to 7 d. The data for ena1 represent the average for three independent ena1 lines. Intracellular Na+ (B) and K+ (C) concentrations in wild-type (black) and ena1 gametophytes (stippled) were calculated after exposure to 100 mm NaCl. Water content of the tissue was determined by weighing the gametophytes before and after drying.
Figure 5.
Figure 5.
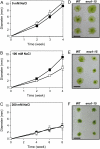
Effect of salt stress on growth of wild-type and ena1 plants. Protoplasts from wild type and ena1 were generated from 1-week-old protonemata to obtain identical starting material for the growth experiment. Protoplasts were allowed to recover for 2 weeks and then transferred to either standard medium (A) or medium with 100 (B) or 200 (C) mm NaCl. Growth of wild-type (black square) and ena1 plants (white square) was followed by measuring the diameter of 40 to 60 colonies from each treatment. Representative wild-type and ena1-15 colonies after 4 weeks of growth on standard medium (D) or medium with 100 mm NaCl (E) or after 8 weeks of growth on 200 mm NaCl (F). Bar = 1 cm.

Similar articles

Cited by

References

    1. Apse MP, Aharon GS, Snedden WA, Blumwald E (1999) Salt tolerance conferred by overexpression of a vacuolar Na+/H+ antiport in Arabidopsis. Science 285 1256–1258 - PubMed
    1. Arnon DI (1949) Copper enzymes in isolated chloroplasts—polyphenoloxidase in Beta vulgaris. Plant Physiol 24 1–15 - PMC - PubMed
    1. Ashton NW, Cove DJ (1977) Isolation and preliminary characterization of auxotrophic and analog resistant mutants of moss, Physcomitrella patens. Mol Gen Genet 154 87–95
    1. Ashton NW, Grimsley NH, Cove DJ (1979) Analysis of gametophytic development in the moss Physcomitrella patens using auxin and cytokinin resistant mutants. Planta 144 427–435 - PubMed
    1. Bañuelos MA, Quintero FJ, Rodríguez-Navarro A (1995) Functional expression of the ENA1(PMR2)-ATPase of Saccharomyces cerevisiae in Schizosaccharomyces pombe. Biochim Biophys Acta 1229 233–238 - PubMed

Publication types

MeSH terms

Associated data

LinkOut - more resources