

A genomewide single-nucleotide-polymorphism panel for Mexican American admixture mapping
- PMID: 17557415
- PMCID: PMC1867091
- DOI: 10.1086/513522
A genomewide single-nucleotide-polymorphism panel for Mexican American admixture mapping
Abstract
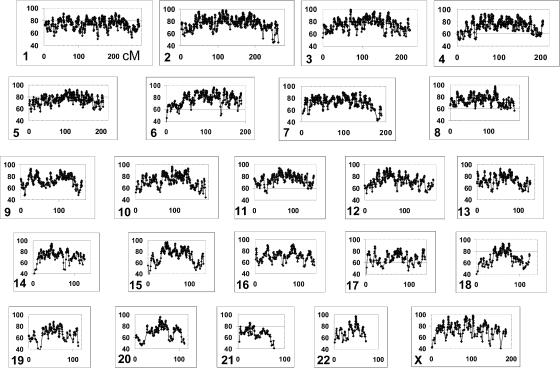
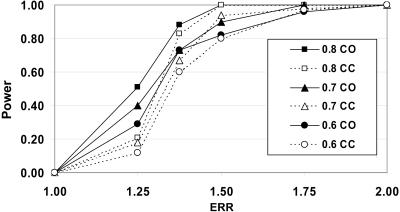
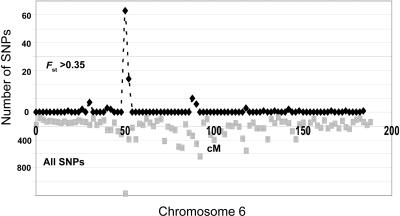
For admixture mapping studies in Mexican Americans (MAM), we define a genomewide single-nucleotide-polymorphism (SNP) panel that can distinguish between chromosomal segments of Amerindian (AMI) or European (EUR) ancestry. These studies used genotypes for >400,000 SNPs, defined in EUR and both Pima and Mayan AMI, to define a set of ancestry-informative markers (AIMs). The use of two AMI populations was necessary to remove a subset of SNPs that distinguished genotypes of only one AMI subgroup from EUR genotypes. The AIMs set contained 8,144 SNPs separated by a minimum of 50 kb with only three intermarker intervals >1 Mb and had EUR/AMI FST values >0.30 (mean FST = 0.48) and Mayan/Pima FST values <0.05 (mean FST < 0.01). Analysis of a subset of these SNP AIMs suggested that this panel may also distinguish ancestry between EUR and other disparate AMI groups, including Quechuan from South America. We show, using realistic simulation parameters that are based on our analyses of MAM genotyping results, that this panel of SNP AIMs provides good power for detecting disease-associated chromosomal segments for genes with modest ethnicity risk ratios. A reduced set of 5,287 SNP AIMs captured almost the same admixture mapping information, but smaller SNP sets showed substantial drop-off in admixture mapping information and power. The results will enable studies of type 2 diabetes, rheumatoid arthritis, and other diseases among which epidemiological studies suggest differences in the distribution of ancestry-associated susceptibility.
Figures
Similar articles
-
A genomewide admixture mapping panel for Hispanic/Latino populations.Am J Hum Genet. 2007 Jun;80(6):1171-8. doi: 10.1086/518564. Epub 2007 Apr 20. Am J Hum Genet. 2007. PMID: 17503334 Free PMC article.
-
Selecting SNPs informative for African, American Indian and European Ancestry: application to the Family Investigation of Nephropathy and Diabetes (FIND).BMC Genomics. 2016 May 4;17:325. doi: 10.1186/s12864-016-2654-x. BMC Genomics. 2016. PMID: 27142425 Free PMC article.
-
Mexican American ancestry-informative markers: examination of population structure and marker characteristics in European Americans, Mexican Americans, Amerindians and Asians.Hum Genet. 2004 Feb;114(3):263-71. doi: 10.1007/s00439-003-1058-6. Epub 2003 Nov 20. Hum Genet. 2004. PMID: 14628215
-
Prospects for admixture mapping of complex traits.Am J Hum Genet. 2005 Jan;76(1):1-7. doi: 10.1086/426949. Epub 2004 Nov 11. Am J Hum Genet. 2005. PMID: 15540159 Free PMC article. Review.
-
Overview of Admixture Mapping.Curr Protoc Hum Genet. 2017 Jul 11;94:1.23.1-1.23.8. doi: 10.1002/cphg.44. Curr Protoc Hum Genet. 2017. PMID: 28696560 Review.
Cited by
-
Softwares and methods for estimating genetic ancestry in human populations.Hum Genomics. 2013 Jan 5;7(1):1. doi: 10.1186/1479-7364-7-1. Hum Genomics. 2013. PMID: 23289408 Free PMC article. Review.
-
A cis-eQTL in PFKFB2 is associated with diabetic nephropathy, adiposity and insulin secretion in American Indians.Hum Mol Genet. 2015 May 15;24(10):2985-96. doi: 10.1093/hmg/ddv040. Epub 2015 Feb 6. Hum Mol Genet. 2015. PMID: 25662186 Free PMC article.
-
Estimating local ancestry in admixed populations.Am J Hum Genet. 2008 Feb;82(2):290-303. doi: 10.1016/j.ajhg.2007.09.022. Am J Hum Genet. 2008. PMID: 18252211 Free PMC article.
-
Evaluation of imputation-based association in and around the integrin-alpha-M (ITGAM) gene and replication of robust association between a non-synonymous functional variant within ITGAM and systemic lupus erythematosus (SLE).Hum Mol Genet. 2009 Mar 15;18(6):1171-80. doi: 10.1093/hmg/ddp007. Epub 2009 Jan 6. Hum Mol Genet. 2009. PMID: 19129174 Free PMC article.
-
Interethnic admixture and the evolution of Latin American populations.Genet Mol Biol. 2014 Mar;37(1 Suppl):151-70. doi: 10.1590/s1415-47572014000200003. Genet Mol Biol. 2014. PMID: 24764751 Free PMC article. Review.
References
Web Resources
-
- Institut fur Humangenetik, http://ihg.gsf.de/cgi-bin/hw/hwa1.pl (for FINETTI software)
-
- Online Mendelian Inheritance in Man (OMIM), http://www.ncbi.nlm.nih.gov/Omim/ (for type 2 diabetes mellitus and rheumatoid arthritis)
-
- Queue at Coriell for NINDS genotypes, https://queue.coriell.org/Q/snp_index.asp
References
Publication types
MeSH terms
Substances
Grants and funding
LinkOut - more resources
Full Text Sources
Other Literature Sources
Research Materials
Miscellaneous
