. 2007 Oct 1;93(7):2491-503.
doi: 10.1529/biophysj.107.104273. Epub 2007 Jun 8.

Pigment spectra and intermolecular interaction potentials in glasses and proteins

Affiliations

Pigment spectra and intermolecular interaction potentials in glasses and proteins

I Renge et al. Biophys J. .

Abstract

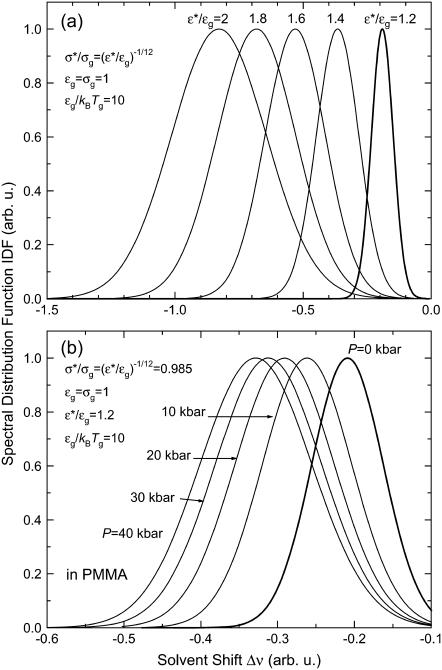
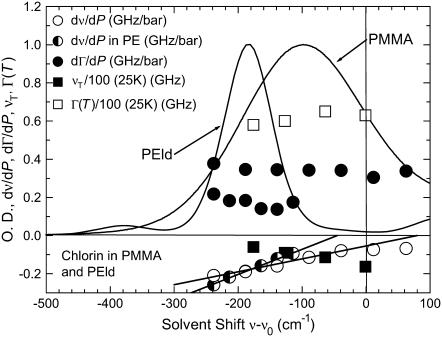
A model is proposed for chromophore optical spectra in solids over a wide range of temperatures and pressures. Inhomogeneous band shapes and their pressure dependence, as well as baric shift coefficients of spectral lines, selected by the frequency, were derived using Lennard-Jones potentials of the ground and excited states. Quadratic electron-phonon coupling constants, describing the thermal shift and broadening of zero-phonon lines, were also calculated. Experimentally, thermal shift and broadening of spectral holes were studied between 5 and 40 K for a synthetic pigment, chlorin, embedded in polymer hosts. The baric effects on holes were determined by applying hydrostatic He gas pressure up to 200 bar, at 6 K. Absorption spectra of pheophytin a, chlorophyll a, and beta-carotene in polymers and plant photosystem II CP47 complex were measured between 5 (or 77) and 300 K, and subject to Voigtian deconvolution. A narrowing of inhomogeneous bandwidth with increasing temperature, predicted on the basis of hole behavior, was observed as the shrinking of Gaussian spectral component. The Lorentzian broadening was ascribed to optical dephasing up to 300 K in transitions with weak to moderate linear electron-phonon coupling strength. The thermal broadening is purely Gaussian in multiphonon transitions (S(2) band of beta-carotene, Soret bands of tetrapyrrolic pigments), and the Lorentz process appears to be suppressed, indicating a lack of exponential dephasing. Density, polarity, polarizability, compressibility, and other local parameters of the pigment binding sites in biologically relevant systems can be deduced from spectroscopic data, provided that sufficient background information is available.


Figures

FIGURE 1
FIGURE 1
Chemical structures of pigments.
FIGURE 2
FIGURE 2
Optical transitions from the ground-state potential surface (Ug) to excited level (U*) (bold arrows); ν0 is the transition energy of nonsolvated chromophore. Dotted curve is the Boltzmann distribution of solvation energies for thermal energy at the glass transition kBTg, equal to one-tenth of the potential well depth in the ground state (Eq. 4).
FIGURE 3
FIGURE 3
(a) Inhomogeneous bands at different relative depths of potential minima, ɛ*/ɛg, calculated from the Boltzmann distribution of solvation energies for a Lennard-Jones potential with ɛg = σg = 1 (Eq. 4), and plotted versus the solvent shift (Eq. 3). The relative equilibrium position of excited state σ*/σg was scaled to as (ɛ*/ɛg)−1/12. (b) Pressure broadening and shift of IDF for ɛ*/ɛg = 1.2 (shown on a different scale also in a), in a host matrix with isothermal compressibility equal to that of PMMA (30).
FIGURE 4
FIGURE 4
Calculated solvent shift dependencies at a displacement of potential minima σ*/σg equal to (ɛ*/ɛg)−1/12 (0.985) for pressure-shift coefficients /dP (multiplied by 0.5, solid straight line), and QEPC constant W (dotted line). Inhomogeneous band shape was calculated as described in Fig. 3.
FIGURE 5
FIGURE 5
Normalized absorption spectra of tetrapyrrolic pigments chlorin, pheophytin a, and chlorophyll a (1–5) and polyenic chromophores (6 and 7), shown on the scale of absolute solvent shift (see Table 2). Chlorin (1) and 1,8-diphenyloctatetraene (7) were measured in PMMA at 6 K, pheophytin a (2 and 5) and chlorophyll a (3 and 4) in PVB at 80 K, and β-carotene in pigment-protein CP47 at 80 K.
FIGURE 6
FIGURE 6
Temperature dependence of (a) S1 (Qy) absorption of pheophytin a and (b) Soret band of chlorophyll a, both in poly(vinyl butyral) films, and (c) S20 (11Bu←11Ag) band of β-carotene in chlorophyll-protein CP47.
FIGURE 7
FIGURE 7
(a) Observed temperature-induced shifts of absorption maxima and (b) phonon-induced shift component νT for chlorin, β-carotene, 1,8-DPOT (in PMMA), pheophytin a, and chlorophyll a (in PVB). The νT was obtained as a difference between the observed shift and solvent shift due to thermal expansion (Eq. 20).
FIGURE 8
FIGURE 8
Temperature-induced shifts of absorption maxima (solid symbols) and the respective pure thermal, phonon-induced component νT (open symbols) for the S1 and Soret transitions of chlorophyll a, and the S20 band of β-carotene in chlorophyll-protein CP47.
FIGURE 9
FIGURE 9
Temperature dependence of the bandwidths of chlorin S1 absorption in PMMA: full-width at half-maximum (fwhm, open circles), double half-width at half-maximum (2hwhm, solid circles), and the respective Gaussian (ΓG, open squares) and Lorentzian (ΓL, solid squares) components of the Voigt fitting of the low-frequency half of the band. Temperature coefficients of a power-law fit are indicated.
FIGURE 10
FIGURE 10
Broadening of spectral holes burned in the S1 absorption of chlorin in PMMA accompanying a pressure or a temperature change. (a) Hole was burned at a He gas pressure of 205 bar, subsequently reduced to 106 bar, at T = 7 K. (b) Hole was burned at 6 K and then warmed up to 27 K. Hole shapes were approximated to Lorentzians, but the fit is poor in the case of pressure change that produces Gaussian broadening.
FIGURE 11
FIGURE 11
Normalized absorption spectra of chlorin in PMMA and PEld at 6 K, and the properties of spectral holes burned at different frequencies: coefficients of pressure shift (/dP, open circles and half-shaded circles) and broadening (dΓ/dP, solid circles) (the same symbol is used for PMMA and PEld), thermal broadening between 6 and 25 K (Γ(T), open squares), and pure thermal shift at 25 K (νT, solid squares) (shown only for PMMA, in GHz units, divided by 100). The pressure shift in PEld and PMMA (thick lines) vanishes either below or above the 0-0 frequency of free pigment (15,912 cm−1 (27)), respectively.
FIGURE 12
FIGURE 12
Thermal shifts of four spectral holes burned at different positions in the absorption band of chlorin in PMMA (open symbols). Phonon-induced shifts νT (thin lines) are calculated from Eq. 20. Hole positions are indicated with respect to 0-0 frequency in vacuum (15,912 cm−1 (27)).

References

    1. Haugland, R. P. 2002. Handbook of Fluorescent Probes and Research Chemicals, 9th ed. Molecular Probes, Eugene, OR. http://probes.invitrogen.com/handbook.
    1. Fritsch, C., and T. Ruzicka. 2003. Fluorescence Diagnosis and Photodynamic Therapy of Skin Diseases. Springer, New York.
    1. K. Sullivan and S. Kay, editors. 1999. Green Fluorescent Proteins. Academic Press, San Diego.
    1. van Amerongen, H., L. Valkunas, and R. van Grondelle. 2000. Photosynthetic Excitons. World Scientific, Singapore.
    1. Mataga, N., and T. Kubota. 1970. Molecular Interactions and Electronic Spectra. Marcel Dekker, New York.

Publication types

LinkOut - more resources