

Three-dimensional distribution of cardiac Na+-Ca2+ exchanger and ryanodine receptor during development
- PMID: 17557789
- PMCID: PMC1965441
- DOI: 10.1529/biophysj.107.104943
Three-dimensional distribution of cardiac Na+-Ca2+ exchanger and ryanodine receptor during development
Abstract
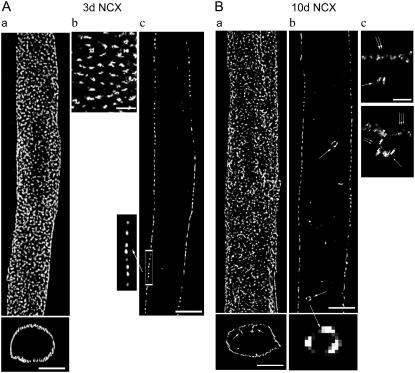
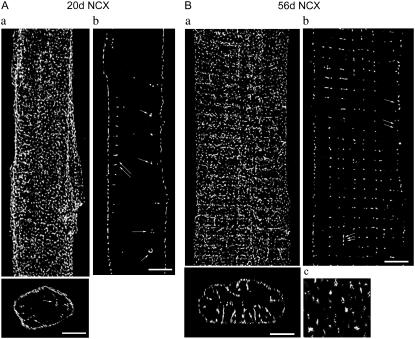
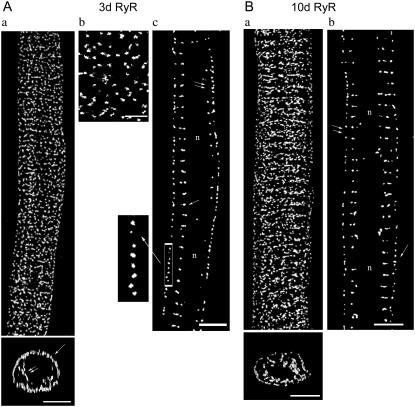
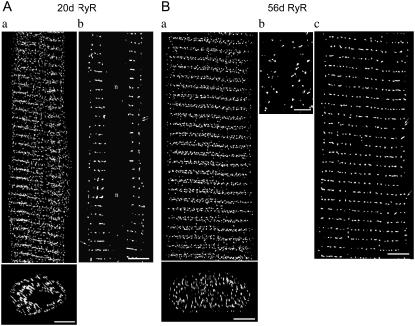
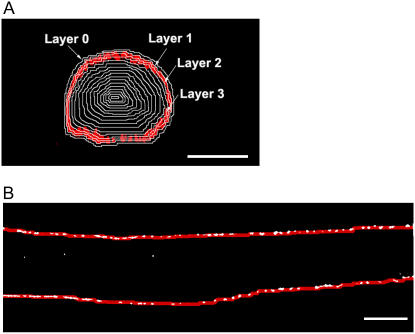
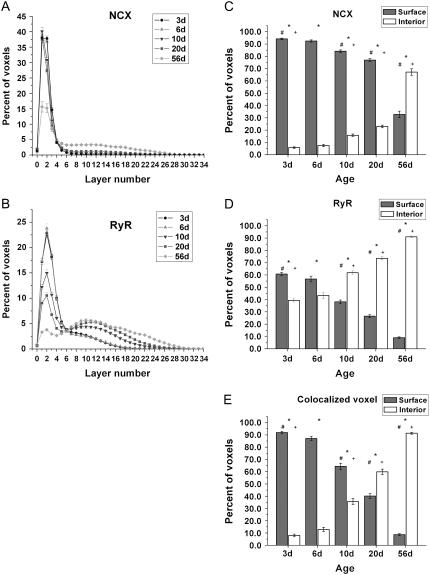
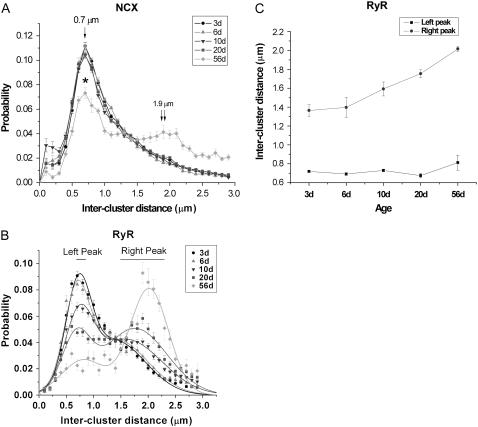
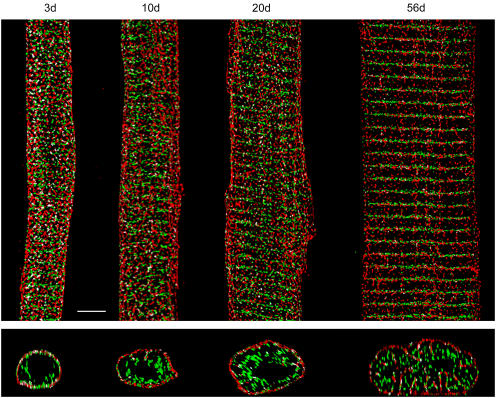
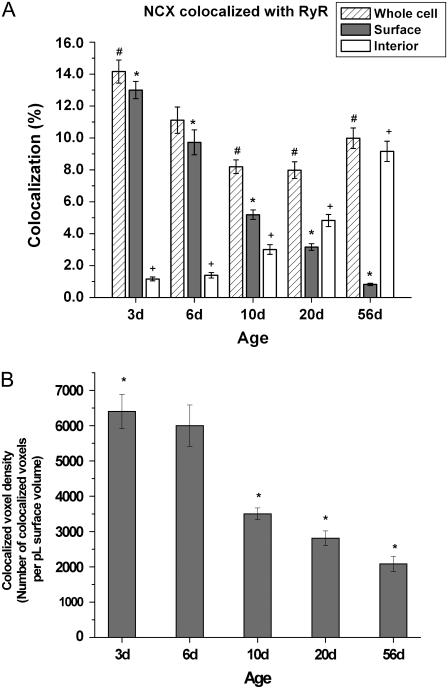
Mechanisms of cardiac excitation-contraction coupling in neonates are still not clearly defined. Previous work in neonates shows reverse-mode Na(+)-Ca(2+) exchange to be the primary route of Ca(2+) entry during systole and the neonatal sarcoplasmic reticulum to have similar capability as that of adult in storing and releasing Ca(2+). We investigated Na(+)-Ca(2+) exchanger (NCX) and ryanodine receptor (RyR) distribution in developing ventricular myocytes using immunofluorescence, confocal microscopy, and digital image analysis. In neonates, both NCX and RyR clusters on the surface of the cell displayed a short longitudinal periodicity of approximately 0.7 microm. However, by adulthood, both proteins were also found in the interior. In the adult, clusters of NCX on the surface of the cell retained the approximately 0.7-microm periodicity whereas clusters of RyR adopted a longer longitudinal periodicity of approximately 2.0 microm. This suggests that neonatal myocytes also have a peri-M-line RyR distribution that is absent in adult myocytes. NCX and RyR colocalized voxel density was maximal in neonates and declined significantly with ontogeny. We conclude in newborns, Ca(2+) influx via NCX could potentially activate the dense network of peripheral Ca(2+) stores via peripheral couplings, evoking Ca(2+)-induced Ca(2+) release.
Figures
Similar articles
-
Ontogeny of Ca2+-induced Ca2+ release in rabbit ventricular myocytes.Am J Physiol Cell Physiol. 2008 Feb;294(2):C516-25. doi: 10.1152/ajpcell.00417.2007. Epub 2007 Dec 19. Am J Physiol Cell Physiol. 2008. PMID: 18094144
-
Chronic intermittent hypoxia alters Ca2+ handling in rat cardiomyocytes by augmented Na+/Ca2+ exchange and ryanodine receptor activities in ischemia-reperfusion.Am J Physiol Cell Physiol. 2007 Jun;292(6):C2046-56. doi: 10.1152/ajpcell.00458.2006. Epub 2007 Jan 31. Am J Physiol Cell Physiol. 2007. PMID: 17267548
-
Subcellular heterogeneity of ryanodine receptor properties in ventricular myocytes with low T-tubule density.PLoS One. 2011;6(10):e25100. doi: 10.1371/journal.pone.0025100. Epub 2011 Oct 13. PLoS One. 2011. PMID: 22022376 Free PMC article.
-
T-tubule remodelling and ryanodine receptor organization modulate sodium-calcium exchange.Adv Exp Med Biol. 2013;961:375-83. doi: 10.1007/978-1-4614-4756-6_32. Adv Exp Med Biol. 2013. PMID: 23224896 Review.
-
Na/Ca exchange and contraction of the heart.J Mol Cell Cardiol. 2013 Aug;61:28-33. doi: 10.1016/j.yjmcc.2013.06.001. Epub 2013 Jun 12. J Mol Cell Cardiol. 2013. PMID: 23770352 Free PMC article. Review.
Cited by
-
Cardiac Na+-Ca2+ exchanger: dynamics of Ca2+-dependent activation and deactivation in intact myocytes.J Physiol. 2013 Apr 15;591(8):2067-86. doi: 10.1113/jphysiol.2013.252080. Epub 2013 Feb 11. J Physiol. 2013. PMID: 23401616 Free PMC article.
-
Modeling effects of L-type ca(2+) current and na(+)-ca(2+) exchanger on ca(2+) trigger flux in rabbit myocytes with realistic T-tubule geometries.Front Physiol. 2012 Sep 10;3:351. doi: 10.3389/fphys.2012.00351. eCollection 2012. Front Physiol. 2012. PMID: 23060801 Free PMC article.
-
Modeling Na+-Ca2+ exchange in the heart: Allosteric activation, spatial localization, sparks and excitation-contraction coupling.J Mol Cell Cardiol. 2016 Oct;99:174-187. doi: 10.1016/j.yjmcc.2016.06.068. Epub 2016 Jul 2. J Mol Cell Cardiol. 2016. PMID: 27377851 Free PMC article.
-
The location of energetic compartments affects energetic communication in cardiomyocytes.Front Physiol. 2014 Sep 29;5:376. doi: 10.3389/fphys.2014.00376. eCollection 2014. Front Physiol. 2014. PMID: 25324784 Free PMC article.
-
The Subcellular Distribution of Ryanodine Receptors and L-Type Ca2+ Channels Modulates Ca2+-Transient Properties and Spontaneous Ca2+-Release Events in Atrial Cardiomyocytes.Front Physiol. 2018 Aug 14;9:1108. doi: 10.3389/fphys.2018.01108. eCollection 2018. Front Physiol. 2018. PMID: 30166973 Free PMC article.
References
-
- Fabiato, A. 1983. Calcium-induced release of calcium from the cardiac sarcoplasmic reticulum. Am. J. Physiol. 245:C1–14. - PubMed
-
- Langer, G. A., and A. Peskoff. 1997. Role of the diadic cleft in myocardial contractile control. Circulation. 96:3761–3765. - PubMed
-
- Huang, J., L. Hove-Madsen, and G. F. Tibbits. 2005. Na+/Ca2+ exchange activity in neonatal rabbit ventricular myocytes. Am. J. Physiol. Cell Physiol. 288:C195–C203. - PubMed
-
- Wetzel, G. T., F. Chen, and T. S. Klitzner. 1995. Na+/Ca2+ exchange and cell contraction in isolated neonatal and adult rabbit cardiac myocytes. Am. J. Physiol. Heart Circ. Physiol. 268:H1723–H1733. - PubMed
Publication types
MeSH terms
Substances
LinkOut - more resources
Full Text Sources
Miscellaneous
