

Relative abundance of the human mitochondrial transcription system and distinct roles for h-mtTFB1 and h-mtTFB2 in mitochondrial biogenesis and gene expression
- PMID: 17557812
- PMCID: PMC1919481
- DOI: 10.1093/nar/gkm424
Relative abundance of the human mitochondrial transcription system and distinct roles for h-mtTFB1 and h-mtTFB2 in mitochondrial biogenesis and gene expression
Abstract
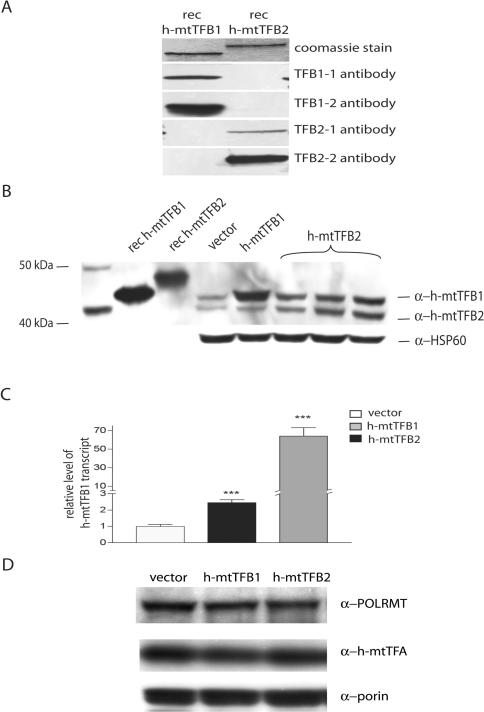
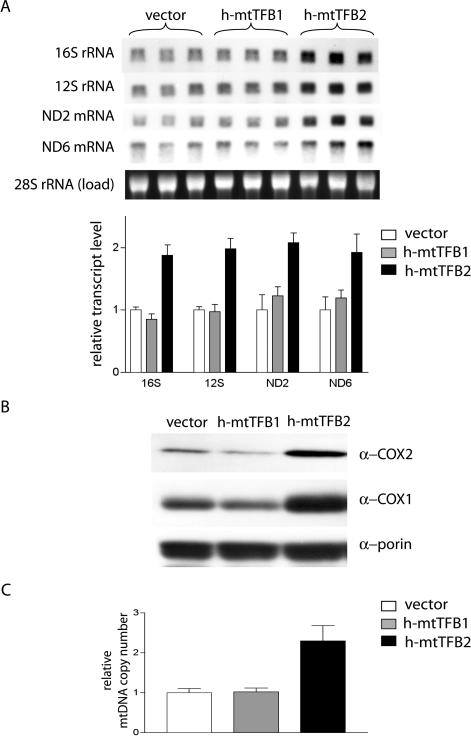
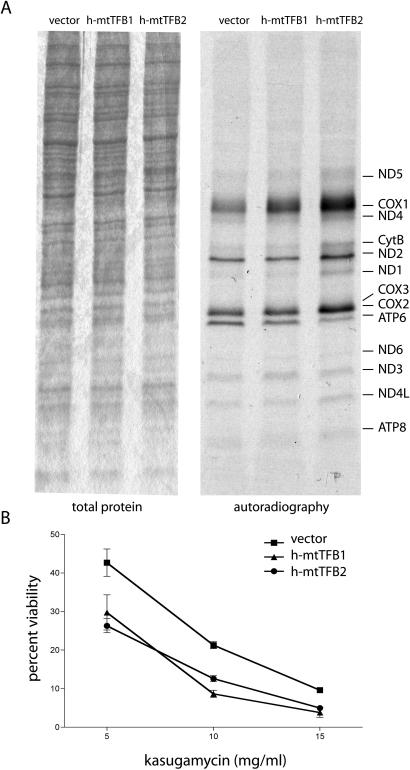
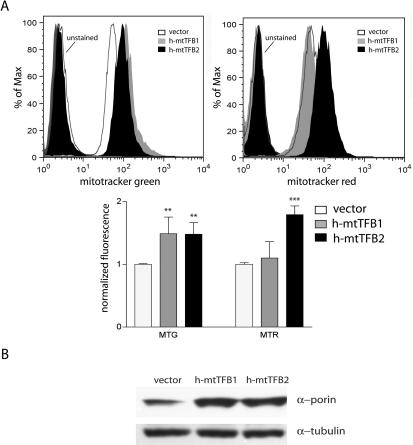
Human mitochondrial transcription requires the bacteriophage-related RNA polymerase, POLRMT, the mtDNA-binding protein, h-mtTFA/TFAM, and two transcription factors/rRNA methyltransferases, h-mtTFB1 and h-mtTFB2. Here, we determined the steady-state levels of these core transcription components and examined the consequences of purposeful elevation of h-mtTFB1 or h-mtTFB2 in HeLa cells. On a per molecule basis, we find an approximately 6-fold excess of POLRMT to mtDNA and approximately 3-fold more h-mtTFB2 than h-mtTFB1. We also estimate h-mtTFA at approximately 50 molecules/mtDNA, a ratio predicted to support robust transcription, but not to coat mtDNA. Consistent with a role for h-mtTFB2 in transcription and transcription-primed replication, increased mitochondrial DNA and transcripts result from its over-expression. This is accompanied by increased translation rates of most, but not all mtDNA-encoded proteins. Over-expression of h-mtTFB1 did not significantly influence these parameters, but did result in increased mitochondrial biogenesis. Furthermore, h-mtTFB1 mRNA and protein are elevated in response to h-mtTFB2 over-expression, suggesting the existence of a retrograde signal to the nucleus to coordinately regulate expression of these related factors. Altogether, our results provide a framework for understanding the regulation of human mitochondrial transcription in vivo and define distinct roles for h-mtTFB1 and h-mtTFB2 in mitochondrial biogenesis and gene expression that together likely fine-tune mitochondrial function.
Figures
Similar articles
-
Transcription-independent role for human mitochondrial RNA polymerase in mitochondrial ribosome biogenesis.Nucleic Acids Res. 2013 Feb 1;41(4):2479-88. doi: 10.1093/nar/gks1447. Epub 2013 Jan 8. Nucleic Acids Res. 2013. PMID: 23303773 Free PMC article.
-
Initiation and beyond: multiple functions of the human mitochondrial transcription machinery.Mol Cell. 2006 Dec 28;24(6):813-25. doi: 10.1016/j.molcel.2006.11.024. Mol Cell. 2006. PMID: 17189185 Review.
-
Human mitochondrial ribosomal protein MRPL12 interacts directly with mitochondrial RNA polymerase to modulate mitochondrial gene expression.J Biol Chem. 2007 Apr 27;282(17):12610-8. doi: 10.1074/jbc.M700461200. Epub 2007 Mar 2. J Biol Chem. 2007. PMID: 17337445 Free PMC article.
-
Human mitochondrial transcription factor B1 interacts with the C-terminal activation region of h-mtTFA and stimulates transcription independently of its RNA methyltransferase activity.Mol Cell Biol. 2003 Aug;23(16):5816-24. doi: 10.1128/MCB.23.16.5816-5824.2003. Mol Cell Biol. 2003. PMID: 12897151 Free PMC article.
-
[Transcription and its regulation in mammalian and human mitochondria].Mol Biol (Mosk). 2009 Mar-Apr;43(2):215-29. Mol Biol (Mosk). 2009. PMID: 19425491 Review. Russian.
Cited by
-
Estradiol and tamoxifen regulate NRF-1 and mitochondrial function in mouse mammary gland and uterus.J Mol Endocrinol. 2013 Sep 10;51(2):233-46. doi: 10.1530/JME-13-0051. Print 2013 Oct. J Mol Endocrinol. 2013. PMID: 23892277 Free PMC article.
-
Drosophila nuclear factor DREF regulates the expression of the mitochondrial DNA helicase and mitochondrial transcription factor B2 but not the mitochondrial translation factor B1.Biochim Biophys Acta. 2013 Oct;1829(10):1136-46. doi: 10.1016/j.bbagrm.2013.07.006. Epub 2013 Jul 31. Biochim Biophys Acta. 2013. PMID: 23916463 Free PMC article.
-
Transcription, Processing, and Decay of Mitochondrial RNA in Health and Disease.Int J Mol Sci. 2019 May 6;20(9):2221. doi: 10.3390/ijms20092221. Int J Mol Sci. 2019. PMID: 31064115 Free PMC article. Review.
-
Elucidation of separate, but collaborative functions of the rRNA methyltransferase-related human mitochondrial transcription factors B1 and B2 in mitochondrial biogenesis reveals new insight into maternally inherited deafness.Hum Mol Genet. 2009 Jul 15;18(14):2670-82. doi: 10.1093/hmg/ddp208. Epub 2009 May 5. Hum Mol Genet. 2009. PMID: 19417006 Free PMC article.
-
35 Years of TFAM Research: Old Protein, New Puzzles.Biology (Basel). 2023 Jun 6;12(6):823. doi: 10.3390/biology12060823. Biology (Basel). 2023. PMID: 37372108 Free PMC article. Review.
References
-
- Bonawitz ND, Clayton DA, Shadel GS. Initiation and beyond: multiple functions of the human mitochondrial transcription machinery. Mol. Cell. 2006;24:813–825. - PubMed
-
- Falkenberg M, Gaspari M, Rantanen A, Trifunovic A, Larsson NG, Gustafsson CM. Mitochondrial transcription factors B1 and B2 activate transcription of human mtDNA. Nat. Genet. 2002;31:289–294. - PubMed
-
- Shutt TE, Gray MW. Homologs of mitochondrial transcription factor B, sparsely distributed within the eukaryotic radiation, are likely derived from the dimethlyadenosine methyltransferase of the mitochondrial endosymbiont. Mol. Biol. Evol. 2006;23:1169–1179. - PubMed
-
- Cotney J, Shadel GS. Evidence for an early gene duplication event in the evolution of the mitochondrial transcription factor B family and maintenance of rRNA methyltransferase activity in human mtTFB1 and mtTFB2. J. Mol. Evol. 2006;63:707–717. - PubMed
