. 2007 Jun;3(6):e110.
doi: 10.1371/journal.pcbi.0030110. Epub 2007 May 2.

CpG island mapping by epigenome prediction

Affiliations

CpG island mapping by epigenome prediction

Christoph Bock et al. PLoS Comput Biol. 2007 Jun.

Abstract

CpG islands were originally identified by epigenetic and functional properties, namely, absence of DNA methylation and frequent promoter association. However, this concept was quickly replaced by simple DNA sequence criteria, which allowed for genome-wide annotation of CpG islands in the absence of large-scale epigenetic datasets. Although widely used, the current CpG island criteria incur significant disadvantages: (1) reliance on arbitrary threshold parameters that bear little biological justification, (2) failure to account for widespread heterogeneity among CpG islands, and (3) apparent lack of specificity when applied to the human genome. This study is driven by the idea that a quantitative score of "CpG island strength" that incorporates epigenetic and functional aspects can help resolve these issues. We construct an epigenome prediction pipeline that links the DNA sequence of CpG islands to their epigenetic states, including DNA methylation, histone modifications, and chromatin accessibility. By training support vector machines on epigenetic data for CpG islands on human Chromosomes 21 and 22, we identify informative DNA attributes that correlate with open versus compact chromatin structures. These DNA attributes are used to predict the epigenetic states of all CpG islands genome-wide. Combining predictions for multiple epigenetic features, we estimate the inherent CpG island strength for each CpG island in the human genome, i.e., its inherent tendency to exhibit an open and transcriptionally competent chromatin structure. We extensively validate our results on independent datasets, showing that the CpG island strength predictions are applicable and informative across different tissues and cell types, and we derive improved maps of predicted "bona fide" CpG islands. The mapping of CpG islands by epigenome prediction is conceptually superior to identifying CpG islands by widely used sequence criteria since it links CpG island detection to their characteristic epigenetic and functional states. And it is superior to purely experimental epigenome mapping for CpG island detection since it abstracts from specific properties that are limited to a single cell type or tissue. In addition, using computational epigenetics methods we could identify high correlation between the epigenome and characteristics of the DNA sequence, a finding which emphasizes the need for a better understanding of the mechanistic links between genome and epigenome.


Conflict of interest statement

Competing interests. The authors have declared that no competing interests exist.

Figures

Figure 1
Figure 1. Conceptual Overview
This figure outlines the workflow used in this study to derive quantitative scores of CpG island strength, and to evaluate their performance as predictors of bona fide CpG islands. The arrows at the top describe the phases of the analysis, the cylinders correspond to input datasets (orange, blue, and brown cylinders) and results datasets (grey and green cylinders), and the rectangular boxes represent major computational steps. The sigmas in the calculation step 3 box stand for summation over the input. The figure is slightly simplified and focuses on a single CpG island map. In fact, the entire workflow was performed separately for three CpG island maps that differ in the repeat-exclusion strategy used (TJU, GGF, and GGM), with subsequent benchmarking of their performances (Figure 5).
Figure 2
Figure 2. Co-Localization between the Five Components of the Open Chromatin Score and the Three CpG Island Maps
(A) shows the relative frequency of overlap between epigenetically modified sites and CpG islands (percentage values). (B) shows the degree of over-representation relative to a simulated case where sites are uniformly distributed over the chromosomes (base-2 log scores). Yellow boxes correspond to frequent overlap, blue boxes to rare overlap. H3D, histone H3K4 dimethylation; H3T, histone H3K4 trimethylation; H3A, histone H3K9/14 acetylation; DHS, DNase I hypersensitive sites; TFS, SP1 transcription factor binding, plus the CpG island abbreviations used throughout this study (TJU, GGF, and GGM). (B) is symmetrical as the result of averaging, therefore only the upper right triangular matrix is reported. (A) is not symmetrical, as is obvious from an example: 51.4% of all 578 known DNase I hypersensitive sites on Chromosomes 21 and 22 overlap with a GGM CpG island, while only 5.0% of all 5,913 GGM CpG islands overlap with an experimentally determined DNase I hypersensitive site.
Figure 3
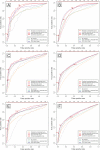
Figure 3. ROC Curves Comparing the Performance of Four Prediction Scores and Three Sequence Criteria against DNA Methylation and Promoter Activity
This figure compares the prediction performance of four CpG island scores that are based on epigenome prediction (upper legend box) and of three simple sequence criteria (lower legend box). In (A), (C), and (E), overlap with unmethylated regions is used for evaluation, and in (B), (D), and (F), overlap with experimentally determined transcription start sites (as an indicator of promoter activity) is used instead. All graphs plot the true positive rate against the false positive rate in the form of ROC curves [27]. The scales on top of the plots display the threshold values for the combined epigenetic score that correspond to the tradeoff between false positive rate and true positive rate at any one position. The thresholds for the combined epigenetic score are highlighted by triangles: 0.5 (balance between sensitivity and specificity), 0.33 (high sensitivity), and 0.67 (high specificity). Averaged across all six graphs, the ROC area under the curve performance measure (i.e., the percentage of the unit square that lies below the ROC curve [27]) amounts to the following values: predicted unmethylated score, 65.4%; predicted promoter activity score, 74.8%; open chromatin score, 72.2%; combined epigenetic score, 75.8%, GC content, 67.1%; CpG observed-to-expected score, 70.6%; and CpG island length, 75.5%.
Figure 4
Figure 4. Box Plots Comparing the Promoter Strength between High-Scoring and Low-Scoring Promoter CpG Islands
This figure shows box plots of the average number of transcription start site tags per CpG island (as an indicator of promoter strength), restricted to those CpG islands that show experimental evidence of promoter activity at all (i.e., at least three transcription start site tags fall within the CpG island). Separate box plots are drawn for CpG islands that fall into different intervals in terms of their combined epigenetic score (i.e., 0 to 0.2, 0.2 to 0.4, etc.). The standard box plot format is used (boxes show center quartiles, whiskers extend to the most extreme data point that is no more than 1.5 times the interquartile range from the box, and non-overlapping notches provide evidence of significantly different medians), and outliers are hidden.
Figure 5
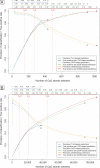
Figure 5. Performance of the Combined Epigenetic Score Compared between CpG Island Maps That Use Different Repeat-Exclusion Strategies
This figure plots the precision (i.e., the percentage of experimentally supported bona fide CpG islands among all selected CpG islands) and the true positive rate (i.e., the percentage of experimentally supported bona fide CpG islands that are selected) over the total number of cases predicted as bona fide CpG islands, for any valid threshold on the combined epigenetic score. Evaluation criteria are absence of DNA methylation (A) and presence of promoter activity as indicated by experimentally determined transcription start sites (B). The three scales on top of each plot display the score thresholds that correspond to the number of CpG islands selected. Dashed lines show the three thresholds that were used to derive the final bona fide CpG island maps on the basis of the GGM dataset. Numbers on the x-axis are significantly lower in (A) than in (B) because of the fact that the DNA methylation dataset covers only a random sample of unmethylated and methylated CpG islands, while the promoter activity dataset covers essentially all nonrepetitive CpG islands genome-wide.
Figure 6
Figure 6. Parallelism between Specific DNA Characteristics and the Epigenetic and Functional State of CpG Islands
This figure illustrates the link between the genome sequence and the epigenome at CpG islands, which enabled us to predict epigenetic states from characteristics of the genome sequence. CpG islands in the human genome can apparently be ordered on a scale of increasingly open and transcriptionally competent chromatin structure (left) and simultaneously on a scale of characteristic DNA attributes (right), with high correlation between both scales.

Similar articles

Cited by

References

    1. Bird A. DNA methylation patterns and epigenetic memory. Genes Dev. 2002;16:6–21. - PubMed
    1. Caiafa P, Zampieri M. DNA methylation and chromatin structure: The puzzling CpG islands. J Cell Biochem. 2005;94:257–265. - PubMed
    1. Bird AP. CpG-rich islands and the function of DNA methylation. Nature. 1986;321:209–213. - PubMed
    1. Antequera F. Structure, function and evolution of CpG island promoters. Cell Mol Life Sci. 2003;60:1647–1658. - PMC - PubMed
    1. Laird PW. Cancer epigenetics. Hum Mol Genet. 2005;14:R65–R76. - PubMed

Publication types

MeSH terms