. 2007 Jun;3(6):e94.
doi: 10.1371/journal.pgen.0030094.

Determinants of cell- and gene-specific transcriptional regulation by the glucocorticoid receptor

Affiliations

Determinants of cell- and gene-specific transcriptional regulation by the glucocorticoid receptor

Alex Yick-Lun So et al. PLoS Genet. 2007 Jun.

Abstract

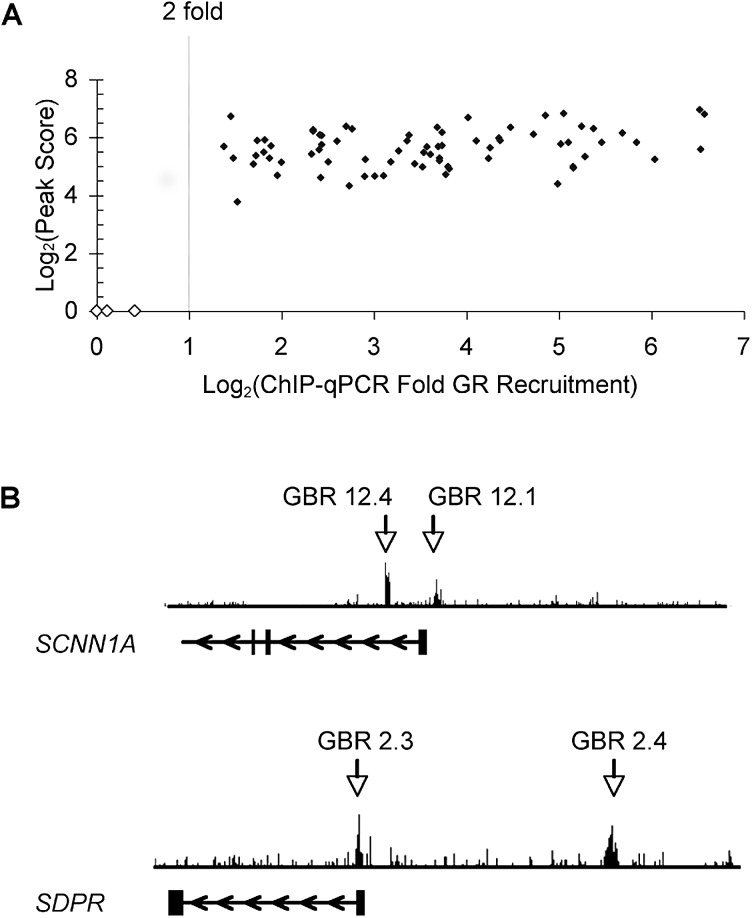
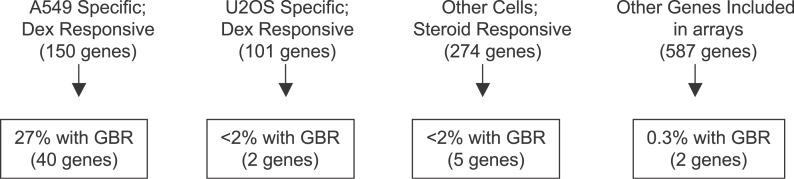
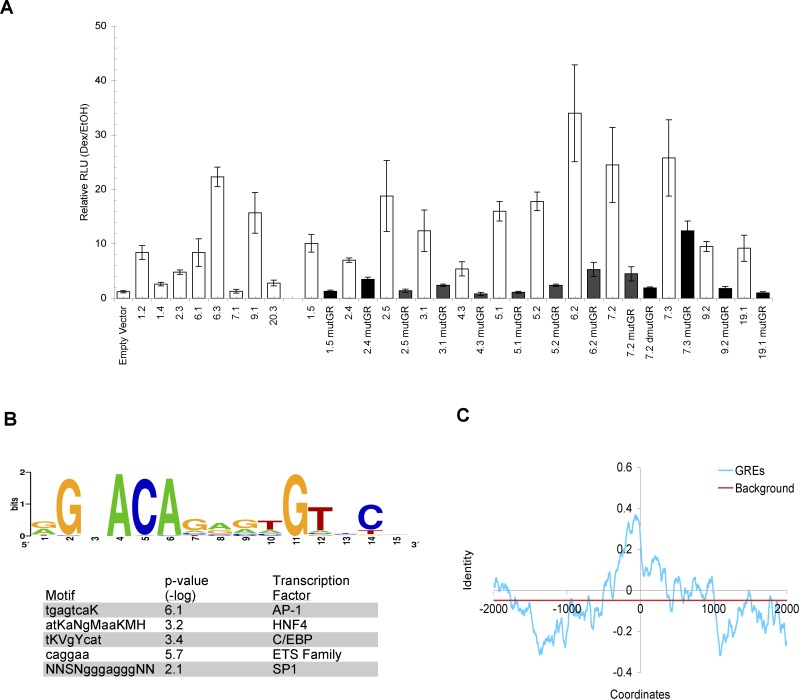
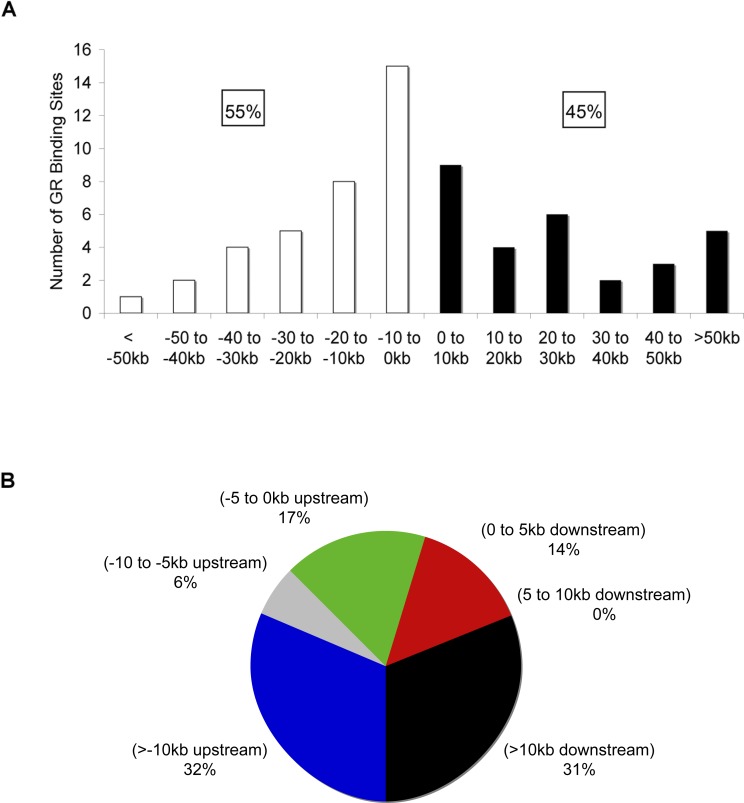
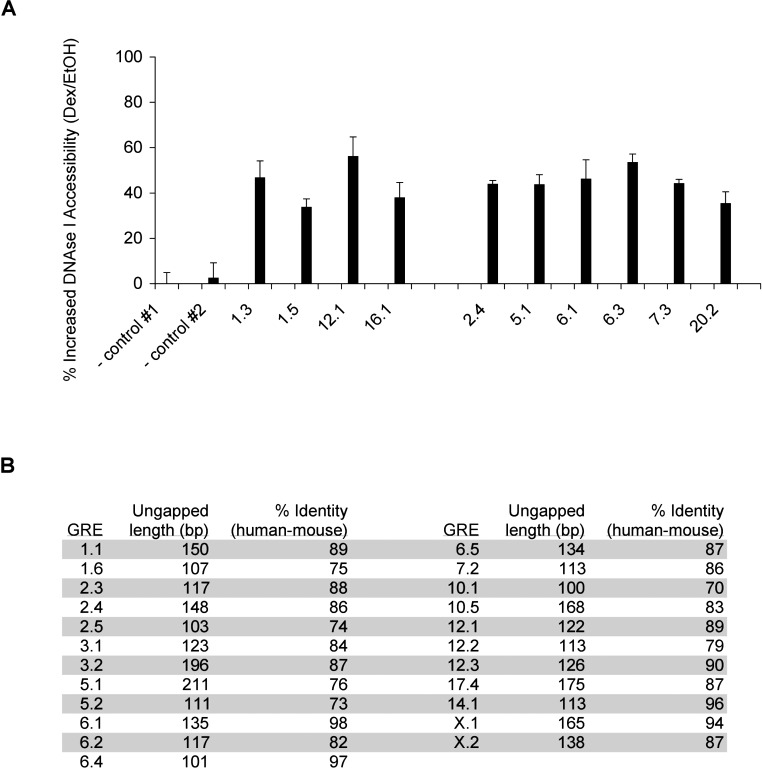
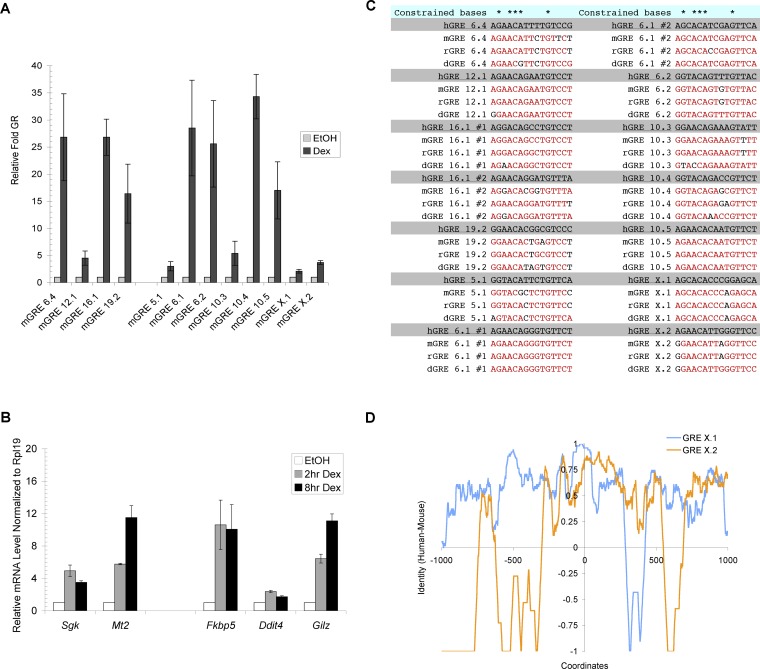
The glucocorticoid receptor (GR) associates with glucocorticoid response elements (GREs) and regulates selective gene transcription in a cell-specific manner. Native GREs are typically thought to be composite elements that recruit GR as well as other regulatory factors into functional complexes. We assessed whether GR occupancy is commonly a limiting determinant of GRE function as well as the extent to which core GR binding sequences and GRE architecture are conserved at functional loci. We surveyed 100-kb regions surrounding each of 548 known or potentially glucocorticoid-responsive genes in A549 human lung cells for GR-occupied GREs. We found that GR was bound in A549 cells predominately near genes responsive to glucocorticoids in those cells and not at genes regulated by GR in other cells. The GREs were positionally conserved at each responsive gene but across the set of responsive genes were distributed equally upstream and downstream of the transcription start sites, with 63% of them >10 kb from those sites. Strikingly, although the core GR binding sequences across the set of GREs varied extensively around a consensus, the precise sequence at an individual GRE was conserved across four mammalian species. Similarly, sequences flanking the core GR binding sites also varied among GREs but were conserved at individual GREs. We conclude that GR occupancy is a primary determinant of glucocorticoid responsiveness in A549 cells and that core GR binding sequences as well as GRE architecture likely harbor gene-specific regulatory information.


Conflict of interest statement

Competing interests. The authors have declared that no competing interests exist.

Figures

Figure 1
Figure 1. ChIP-Chip Identified Known and Novel GR Binding Regions
(A) Identification of GBRs. The Log2(peak score) of GBRs obtained from the ChIP-chip arrays is plotted versus the dex-induced enrichment of GR at the corresponding GBR, which was assessed by GR ChIP-qPCR (averaged over at least three independent experiments. Note: dex-induced GR binding at the GBRs reproducibly in all the individual experiments). Solid diamonds, bona fide GBRs; open diamonds, negative control regions. (B) GBRs identified near SCNN1A and SDPR genes. Vertical bars, exons; horizontal lines, introns; arrows, direction of transcription. GBRs 12.1 and 2.3 are known promoter proximal GBRs associated with SCNN1A and SDPR, respectively. GBRs 12.4 and 2.4 are novel GBRs identified in the present work. GBR nomenclature: unique identifiers corresponding to the human chromosome number containing the GBR followed by an arbitrary integer tag.
Figure 2
Figure 2. Percentage of Genes Associated with One or More GBRs in A549 Cells
A549-specific dex-responsive genes are regulated by GR in A549 cells but not U2OS cells. U2OS-specific dex-responsive genes are regulated by GR in U2OS cells but not in A549 cells. The 34 genes regulated by GR in both A549 and U2OS cells, 12 of which associated with an A549 GBR, were excluded from the analysis shown. Genes responsive to glucocorticoids or androgens in cells other than A549 and U2OS are denoted as “other cells steroid responsive.” Lastly, additional genes that were wholly or partially included in our ChIP-chip arrays due to the extensive sampling of regions around all the genes mentioned above are represented as “genes included in arrays.”
Figure 3
Figure 3. Native Chromosomal GREs Are Composite Elements
(A) GBRs confer glucocorticoid responsiveness. A549 cells transfected with luciferase reporter genes linked to 500 bp GBRs were treated with EtOH or 100 nM dex for 5–7 h, harvested, and measured for luciferase activity. Fold dex inductions are plotted for wildtype (white) reporters and mutant (black) reporters with singly (mutGR) or doubly mutated (dmutGR) GR binding sites; standard errors of mean over at least three independent experiments are shown. The 13 mutated GR binding sites were randomly chosen. The GREs that harbor these GR binding sites represent a range of enriched GBRs, ranging from ~6- to 40-fold dex-induced GR occupancy as assessed by ChIP-qPCR (unpublished data). (B) Identification of enriched motifs within GBRs is shown. Top panel: Sequence logo, generated using WebLogo [58], represents all the compiled sequences resembling GR binding sites identified through computational analysis. Bottom panel shows other enriched motifs (displayed in IUPAC symbols) found in the GRE sequences. Motifs resembling AP-1, HNF4, and C/EBP binding sites were identified using BioProspector whereas motifs similar to ETS and SP1 binding sites were found with MobyDick. The p-values of the enriched motifs represent the random probability of these motifs occurring within the GREs. (C) Conservation analysis of GREs. The identity of the human and mouse sequences was calculated as number of bp matches minus the number of bp deletions or insertions, divided by a 50-bp window. Shown are the average identities for each window across 50 GREs. The background level was calculated as the average of all conservation scores across the 4-kb region. The abscissa shows bp positions with 0 defined as the center of core GR binding sites for GREs.
Figure 4
Figure 4. Location and Position of GREs
(A) Locations of GREs relative to the TSS of target genes. The number of GREs resident in 10-kb increments relative to the TSS of the target gene are plotted. White bars and black bars represent GREs upstream and downstream of the TSS, respectively. (B) Distribution of GREs relative to target gene transcription start site is shown. The chart presents percentage of GREs at various positions upstream and downstream of target genes. Note that only 64 of the 73 GREs detected in A549 cells were included in these analyses; the remaining nine GREs did not associate with a dex-responsive gene in these cells. The GREs were assigned to the nearest gene regulated by GR in A549 cells from the final list of genes that were included or impinged upon by the ChIP-chip arrays. Coordinates of TSSs were obtained from UCSC Genome Browser based on RefSeq. Similar results were obtained when we used TSS coordinates that were experimentally determined (DataBase of Transcriptional Start Sites) through 5′ end cloning (unpublished data) [59]. The TSS of the longest transcript was used for genes that have multiple alternative TSSs. Similar results were obtained if the GREs were assigned the closest TSS of the associated dex-responsive gene: 38% of GREs were located downstream from TSS; 58% of GREs were positioned farther than 10 kb from the assigned TSSs.
Figure 5
Figure 5. Some GREs Are Conserved Nongenic Sequences That Exhibit Increased DNAse I Accessibility Upon GR Occupancy
(A) Dex induces increased DNAse I accessibility. Nuclei from A549 cells treated with EtOH or dex for 1 h were isolated, treated with DNAse I, and harvested for DNA. The relative amount of the DNA at the corresponding region were assessed by qPCR and presented as percent cleavage, with standard error of mean averaged among at least three independent experiments. Controls #1 and #2 correspond to regions near AMOTL2 and CDH17 genes, respectively, which do not exhibit dex-induced GR occupancy (unpublished data). (B) Human–mouse sequence conservation within GREs is presented. The mouse sequences aligned with 500-bp human GRE sequences were obtained from UCSC Genome Browser. The lengths of the continuous GRE sequences without gaps between human and mouse are shown, and the percent identity of these regions were calculated as number of matched base pairs divided by length of fragment.
Figure 6
Figure 6. Sequence of GREs as Determinants of Gene-Specific Transcriptional Regulation by GR
(A) Binding of GR at mouse orthologs of primary GR target genes from human A549 cells is shown. ChIP experiments were performed to monitor GR binding in EtOH and dex-treated C3H10T1/2 cells at genes shown. Immunoprecipitated DNA samples were analyzed with qPCR and normalized to a region near the mouse Hsp70 gene. The nomenclature mGRE represents GRE sequences detected in the mouse genome. (B) Genes adjacent to GREs are regulated by GR in C3H10T1/2 cells. Reverse transcribed RNA samples (cDNA) from C3H10T1/2 cells treated with EtOH or 100 nM dex were subjected to qPCR and normalized to mouse Rpl19 transcripts. (C) Core GR binding sequences are highly conserved. GR binding sequences from human (h), mouse (m), rat (r), and dog (d) are shown. Red sequences represent bases that are identical to that of human. Note that GREs 6.1 and 16.1 each contain two GR binding sites. (D) Comparative sequence conservation across individual GREs. Sequence identities between human and mouse of GRE X.1 and X.2 were obtained using the same calculation as Figure 3C. The coordinates represent bp positions with 0 defined as the center of core GR binding sites.

References

    1. Jobe AH, Ikegami M. Lung development and function in preterm infants in the surfactant treatment era. Annu Rev Physiol. 2000;62:825–846. - PubMed
    1. Yamamoto KR, Darimont BD, Wagner RL, Iniguez-Lluhi JA. Building transcriptional regulatory complexes: Signals and surfaces. Cold Spring Harb Symp Quant Biol. 1998;63:587–598. - PubMed
    1. Wang JC, Derynck MK, Nonaka DF, Khodabakhsh DB, Haqq C, et al. Chromatin immunoprecipitation (ChIP) scanning identifies primary glucocorticoid receptor target genes. Proc Natl Acad Sci U S A. 2004;101:15603–15608. - PMC - PubMed
    1. Rogatsky I, Wang JC, Derynck MK, Nonaka DF, Khodabakhsh DB, et al. Target-specific utilization of transcriptional regulatory surfaces by the glucocorticoid receptor. Proc Natl Acad Sci U S A. 2003;100:13845–13850. - PMC - PubMed
    1. Chandler VL, Maler BA, Yamamoto KR. DNA sequences bound specifically by glucocorticoid receptor in vitro render a heterologous promoter hormone responsive in vivo. Cell. 1983;33:489–499. - PubMed

Publication types