. 2007 Jun 8:2:11.
doi: 10.1186/1749-8104-2-11.

Zac1 functions through TGFbetaII to negatively regulate cell number in the developing retina

Affiliations

Zac1 functions through TGFbetaII to negatively regulate cell number in the developing retina

Lin Ma et al. Neural Dev. .

Abstract

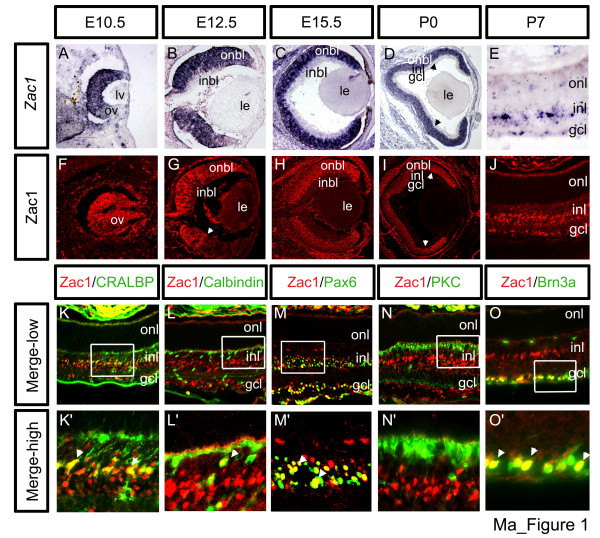
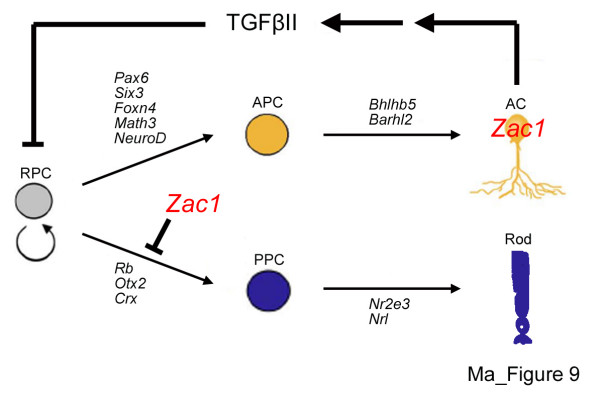
Background: Organs are programmed to acquire a particular size during development, but the regulatory mechanisms that dictate when dividing progenitor cells should permanently exit the cell cycle and stop producing additional daughter cells are poorly understood. In differentiated tissues, tumor suppressor genes maintain a constant cell number and intact tissue architecture by controlling proliferation, apoptosis and cell dispersal. Here we report a similar role for two tumor suppressor genes, the Zac1 zinc finger transcription factor and that encoding the cytokine TGFbetaII, in the developing retina.

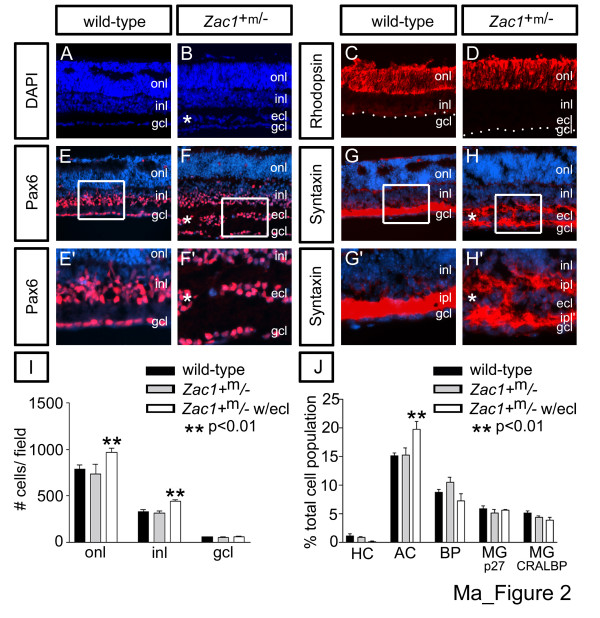
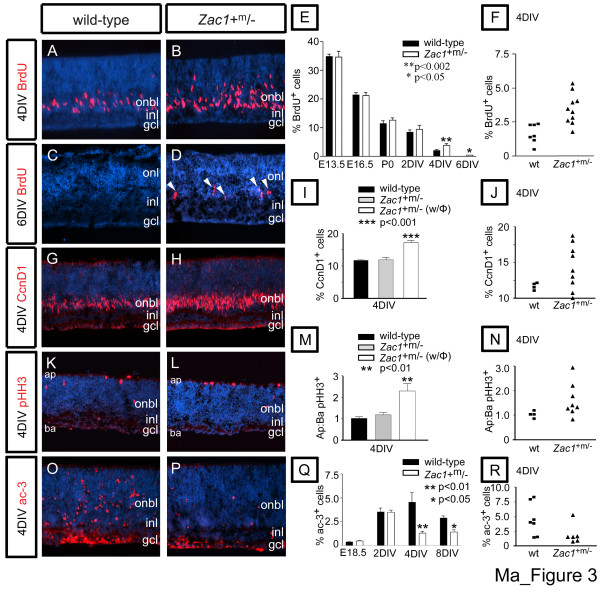
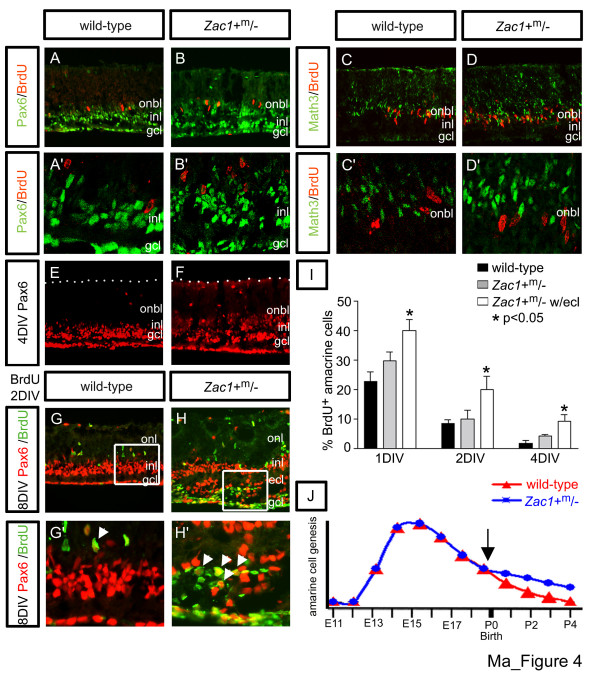
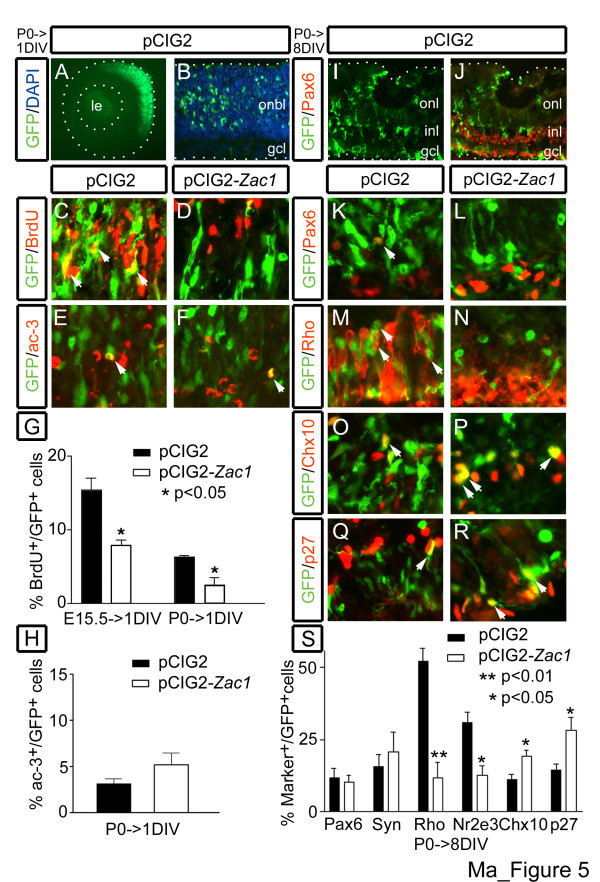
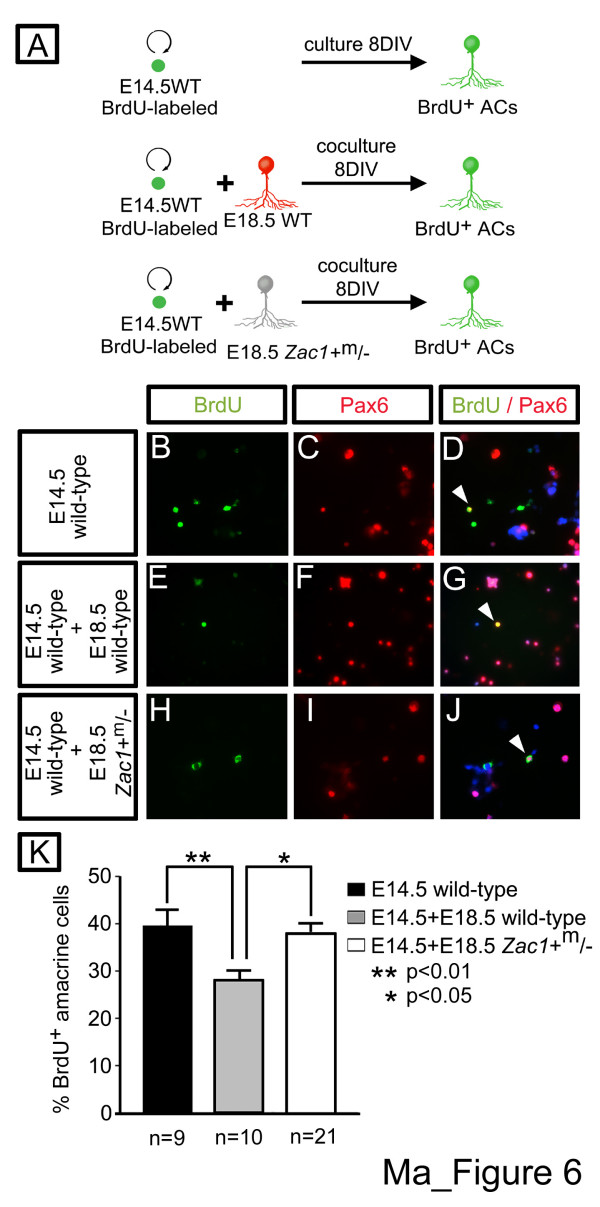
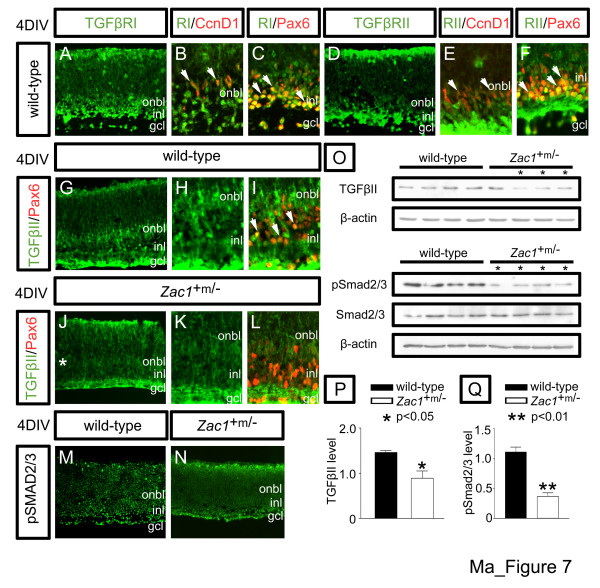
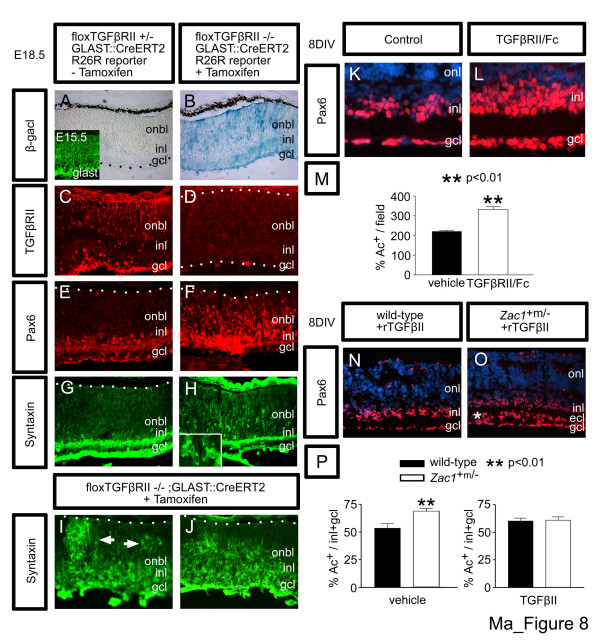
Results: Using loss and gain-of-function approaches, we show that Zac1 is an essential negative regulator of retinal size. Zac1 mutants develop hypercellular retinae due to increased progenitor cell proliferation and reduced apoptosis at late developmental stages. Consequently, supernumerary rod photoreceptors and amacrine cells are generated, the latter of which form an ectopic cellular layer, while other retinal cells are present in their normal number and location. Strikingly, Zac1 functions as a direct negative regulator of a rod fate, while acting cell non-autonomously to modulate amacrine cell number. We implicate TGFbetaII, another tumor suppressor and cytokine, as a Zac1-dependent amacrine cell negative feedback signal. TGFbetaII and phospho-Smad2/3, its downstream effector, are expressed at reduced levels in Zac1 mutant retinae, and exogenous TGFbetaII relieves the mutant amacrine cell phenotype. Moreover, treatment of wild-type retinae with a soluble TGFbeta inhibitor and TGFbeta receptor II (TGFbetaRII) conditional mutants generate excess amacrine cells, phenocopying the Zac1 mutant phenotype.

Conclusion: We show here that Zac1 has an essential role in cell number control during retinal development, akin to its role in tumor surveillance in mature tissues. Furthermore, we demonstrate that Zac1 employs a novel cell non-autonomous strategy to regulate amacrine cell number, acting in cooperation with a second tumor suppressor gene, TGFbetaII, through a negative feedback pathway. This raises the intriguing possibility that tumorigenicity may also be associated with the loss of feedback inhibition in mature tissues.


Figures

Figure 1
Figure 1
Biphasic Zac1 expression in the retina. Zac1 (a-e) transcript and protein (f-j) distribution from E10.5 to P7. Arrowheads in (d,g,i) mark limits of higher expression domains. (k-o) Identification of Zac1+ P7 retinal cells. Co-labeling with Zac1 (red) and CRALBP (green (k,k')), calbindin (green (l,l')), Pax6 (green (m,m')), PKC (green (n,n')) and Brn3a (green (o,o')). High magnification images of boxed areas are shown in (k'-o'). Arrowheads mark double+ cells. Of 2,154 Zac1+ cells analyzed, 1,238 CRALBP/Zac1 double+ Müller glia; 29 calbindin/Zac1 double+ horizontal cells (based also on morphology), 480 Pax6/Zac1 double+ amacrine cells (in the INL) and 407 Brn3a/Zac1 double+ RGCs were identified. GCL, ganglion cell layer; inbl, inner neuroblast layer; INL, inner nuclear layer; le, lens; lv, lens vesicle; onbl, outer neuroblast layer; ONL, outer nuclear layer; ov, optic vesicle.
Figure 2
Figure 2
Zac1+m/- retinae develop an ectopic amacrine cell layer and supernumerary rod photoreceptors. (a-h) E18.5→8DIV retinal explants. DAPI-stained (a) wild-type and (b) Zac1+m/- explants. Rhodopsin expression in (c) wild-type and (d) Zac1+m/-+ ECL retinae. (e,e',f,f') Pax6 and (g,g',h,h') syntaxin expression in amacrine cells in wild-type (e,e',g,g') and Zac1+m/-+ECL (f,f',h,h') retinae. Asterisks mark the ECL. The duplicated IPL is labeled by ipl' in (h'). Blue is DAPI counterstain. (i) Average of the absolute number of DAPI+ nuclei/layer in a standard counting field in wild-type (black bar; total DAPI+ nuclei counted in 30 fields; ONL: 23,700; INL: 9,870; GCL: 1,776), Zac1+m/- without an ECL (grey bar; total DAPI+ nuclei counted in 9 fields; ONL: 6,615; INL: 2,826; GCL: 498 nuclei) and Zac1+m/-+ECL (white bar; total DAPI+ nuclei counted in 27 fields; ONL: 26,175; INL: 11,968; GCL: 1,674). (j) Percentage of each retinal cell type based on total cell counts in wild-type (black bar; HC: 56 calbindin+/7,183 DAPI+; AC: 1,832 Pax6+/11,696 DAPI+; BP: 819 Chx10+/9,302 DAPI+; MG: 1,003 p27+/18,465 DAPI+ nuclei; 537 CRALBP+/9,169 DAPI+), Zac1+m/- without an ECL (grey bar; HC: 64 calbindin+/12,960 DAPI+; AC: 1,558 Pax6+/10,304 DAPI+; BP: 1,077 Chx10+/10,171 DAPI+; MG: 430 p27+/9,966 DAPI+; 332 CRALBP+/6,773 DAPI+) and Zac1+m/-+ECL retinae (white bar; HC: 11 calbindin+/1,924 DAPI+; AC: 2,068 Pax6+/11,302 DAPI+; BP: 646 Chx10+/9,157 DAPI+; MG: 395 p27+/9,921 DAPI+; 240 CRALBP+/3,319 DAPI+). AC, amacrine cell; BP, bipolar cell; HC, horizontal cell; MG, Müller glia.
Figure 3
Figure 3
Loss of Zac1 results in increased proliferation and reduced apoptosis at a late stage of retinogenesis. (a-d) BrdU labeling (red) of E18.5 wild-type and Zac1+m/- explants cultured 4DIV (a,b) or 6DIV (c,d). Arrowheads in (d) mark ectopic proliferating cells. (e) Percentage of BrdU+ nuclei in wild-type (black bar; E13.5: 2,824 BrdU+/8,235 DAPI+; E16.5: 2,234 BrdU+/10,663 DAPI+; E18.5: 2,859 BrdU+/27,380 DAPI+; E18.5→2DIV: 4,371 BrdU+/54,554 DAPI+; E18.5→4DIV: 988 BrdU+/55,300 DAPI+; E18.5→6DIV: 0 in 9 fields) and Zac1+m/- retinae (grey bars; E13.5: 3,555 BrdU+/10,413 DAPI+; E16.5: 3,369 BrdU+/15,707 DAPI+; E18.5: 2,212 BrdU+/17,642 DAPI+; E18.5→2DIV: 3,298 BrdU+/35,085 DAPI+; E18.5→4DIV: 3,474 BrdU+/97,499 DAPI+; E18.5→6DIV: 54 BrdU+/11,618 DAPI+). (f) BrdU-labeling indices of individual wild-type (squares) and Zac1+m/- (triangles) E18.5→4DIV retinal explants. (g,h) E18.5→4DIV wild-type (g) and Zac1+m/- (h) retinal explants labeled with CcnD1 (red). (i) Percentage of Ccdn1+ cells in wild-type (black bar; 2,480 CcnD1+/21,329 DAPI+) and Zac1+m/- without aberrant proliferation (grey bar; 3,156 CcnD1+/26,328 DAPI+) and with a proliferative phenotype (w/φ; white bar; 3,266 CcnD1+/18,709 DAPI+) at 4DIV. (j) Ccnd1-labeling indices of individual wild-type (squares) and Zac1+m/- (triangles) E18.5→4DIV retinal explants. (k,l) E18.5→4DIV wild-type (k) and Zac1+m/- (l) retinal explants labeled with pHH3 (red). (m) Apical (Ap) to basal (Ba) ratio of pHH3+ cells in wild-type (black bar; 808 ap:791 ba pHH3+) and Zac1+m/- without (grey bar; 971 ap:796 ba pHH3+) and with (w/φ; white bar; 1,012 ap:480 ba pHH3+) a proliferative phenotype at 4DIV. (n) Ap:Ba ratios of pHH3+ cells in individual wild-type (squares) and Zac1+m/- (triangles) E18.5→4DIV retinal explants. (o-p) Active caspase-3 (Ac-3) expression (red) in wild-type and Zac1+m/- E18.5→4DIV explants. Blue is DAPI counterstain. (q) Percentage of apoptotic cells in the total population of wild-type (black bars; E18.5: 71 ac-3+/18,341 DAPI+; E18.5→2DIV: 532 ac-3+/14,995 DAPI+; E18.5→4DIV: 1,266 ac-3+/27,321 DAPI+; E18.5→8DIV: 294 ac-3+/10,209 DAPI+) and Zac1+m/- (white bars; E18.5: 67 ac-3+/13,768 DAPI+; E18.5→2DIV: 457 ac-3+/13,195 DAPI+; E18.5→4DIV: 488 ac-3+/24,077 DAPI+; E18.5→8DIV: 212 ac-3+/14,377 DAPI+) retinae. (r) Distribution of individual wild-type (squares) and Zac1+m/- (triangles) ac-3-labeling indices at 4DIV.
Figure 4
Figure 4
Amacrine cell genesis is elevated postnatally in Zac1+m/- retinae. (a-d) E18.5→4DIV wild-type (a,a',c,c') and Zac1+m/- (b,b',d,d') explants co-labeled with BrdU (red, S-phase) and Pax6 (green; amacrine cells (a,a',b,b') or Math3 (green; amacrine and bipolar precursors in INL (c,c',d,d'). (e,f) E18.5→4DIV explants labeled with Pax6 alone (red). (g,g',h,h') Birthdating of E18.5→8DIV wild-type (g,g') and Zac1+m/- (h,h') retinal explants exposed to BrdU (green) at 2DIV and co-labeled with anti-Pax6 (red). BrdU/Pax6 double+ cells are marked by arrowheads in (g',h'), which are high magnification images of boxed areas in (g,h), respectively. (i) Percentage of BrdU/Pax6 double+ nuclei (amacrine cells born at time of BrdU exposure) in wild-type (black bar; BrdU at 1DIV: 562 BrdU/Pax6 double+/2,385 Pax6+; 2DIV: 527 BrdU/Pax6 double+/6,022 Pax6+; 4DIV: 77 BrdU/Pax6 double+/1,496 Pax6+; all counts in 8DIV explants) and Zac1+m/- explants without an ECL (grey bar; BrdU at 1DIV: 1,307 BrdU/Pax6 double+/4,084 Pax6+; 2DIV: 527 BrdU/Pax6 double+/4,926 Pax6+; 4DIV: 75 BrdU/Pax6 double+/1,660 Pax6+) and Zac1+m/-+ECL explants (white bar; BrdU at 1DIV: 2,126 BrdU/Pax6 double+/6,107 Pax6+; 2DIV: 883 BrdU/Pax6 double+/4,386 Pax6+; 4DIV: 335 BrdU/Pax6 double+/3,587 Pax6+). (j) Model of amacrine cell genesis in wild-type (red line) versus Zac1+m/-+ECL (blue line) retinae.
Figure 5
Figure 5
Zac1 inhibits cell division and rod fate specification. (a-f) P0 retinae electroporated with pCIG2 control (a-c,e) or pCIG2-Zac1 (d,f) cultured 1DIV. GFP+ electroporated cells (green (a-f)) labeled with anti-BrdU (red (c,d)) and anti-ac-3 (red (e,f)). Blue in (b) is DAPI counterstain. (g) Percentage of GFP+ cells that incorporated BrdU after electroporation of pCIG2 (black bar; E15.5→1DIV: 88 BrdU/GFP double+/542 GFP+; P0→1DIV: 124 BrdU/GFP double+/1,784 GFP+) and pCIG2-Zac1 (white bar; E15.5→1DIV: 24 BrdU/GFP double+/290 GFP+; P0→1DIV: 14 BrdU/GFP double+/816 GFP+). (h) Percentage of GFP+ cells that expressed ac-3 in P0→1DIV retinae electroporated with pCIG2 (black bar; 157 ac-3/GFP double+/5,402 GFP+) and pCIG2-Zac1 (white bar; 97 ac-3/GFP double+/1,808 GFP+). (i-r) P0→8DIV retinae electroporated with pCIG2 (i-k,m,o,q) or pCIG2-Zac1 (l,n,p,r). GFP+ electorporated cells (green (i-r)) co-labeled with Pax6 (red; amacrine cells (j-l)), rhodopsin (red; rods (m,n)), Chx10 (red; bipolar (o,p)) and p27Kip1 (red; Müller glia (q,r)). (s) Percentage of GFP+ cells expressing cell-type specific markers post-electroporation of pCIG2 (black bar; 290 Pax6/GFP double+/3,939 GFP+; 81 syntaxin/GFP double+/552 GFP+; 955 rhodopsin/GFP double+/1,751 GFP+; 384 Nr2e3/GFP double+/1,261 GFP+; 279 Chx10/GFP double+/3,146 GFP+; 520 p27/GFP double+/3,846 GFP+) or pCIG2-Zac1 (white bar; 140 Pax6/GFP double+/1,284 GFP+; 83 syntaxin/GFP double+/376 GFP+; 56 rhodopsin/GFP double+/356 GFP+; 131 Nr2e3/GFP double+/816 GFP+; 263 Chx10/GFP double+/1,455 GFP+; 541 p27/GFP double+/1,888 GFP+). Arrowheads mark double+ cells. le, lens; Rho, Rhodopsin; Syn, Syntaxin.
Figure 6
Figure 6
Zac1+m/- retinae lose amacrine cell feedback inhibition. (a) Schematic of aggregation assay protocol. (b-j) Immunolabeling of dissociated cell pellets with Pax6 (red (c,d,f,g,i,j)), BrdU (green (b,d,e,g,h,j)) and merged image with DAPI (blue (d,g,j)). E14.5 progenitors cultured alone (b-d) or with E18.5 wild-type (e-g) or Zac1+m/- (h-j) retinal cells. Arrowheads mark Pax6/BrdU double+ nuclei (d,g,j). (k) Percentage of BrdU+ E14.5 cells that differentiated into Pax6+ amacrine cells when cultured alone (black bar; 1,085 BrdU/Pax6 double+/2,892 BrdU+) or with E18.5 wild-type (grey bar; 853 BrdU/Pax6 double+/3,215 BrdU+) or Zac1+m/- (white bar; 2,559 BrdU/Pax6 double+/7,196 BrdU+) retinal cells. n indicates number of individual retinal aggregates quantified.
Figure 7
Figure 7
Zac1 regulates TGFβII signaling in the retina. (a-f) Co-expression of TGFβRI (green (a-c)) and TGFβRII (green (d-f)) with Ccnd1 (red, proliferating progenitors (b,e)) and Pax6 (red, amacrine cells (c,f)) in E18.5 > 4DIV wild-type retinal explants. (g-l) TGFβII expression in E18.5→4DIV wild-type (green (g-i)) and Zac1+m/- (green (j-l)) retinal explants co-labeled with Pax6 (red, amacrine cells (i,l)). Arrowheads mark double+ cells. Asterisk in (j) marks reduction in onbl/INL expression. (m,n) Expression of pSmad2/3 in E18.5→4DIV wild-type (m) and Zac1+m/- (n) retinal explants. (o) Western blot analysis of TGFβII, pSmad2/3, total Smad2/3, and β-actin. Asterisks in (o) indicate mutants with reduced expression of TGFβII or pSmad2/3. (p,q) Quantitation of expression levels normalized to β-actin via densitometry for TGFβII (p) and pSmad2/3 (q).
Figure 8
Figure 8
TGFβII negatively regulates amacrine cell genesis. (a,b) X-gal staining of E18.5 GLAST::CreERT2+/-;R26R reporter+ transgenic without (a) and with (b) administration of tamoxifen at E16. Inset in (a) shows GLAST immunostaining of E15.5 retina. (c-j) Analysis of TGFβRII+/-;GLAST::CreERT2+/-;R26R+ (c,e,g) and TGFβRII-/-;GLAST::CreERT2+/-;R26R+ (d,f,h,i,j) retinae immunostained with anti-TGFβRII (c,d), Pax6 (e,f) and syntaxin (g-j). Arrowheads in (i) mark ectopic amacrine cell clusters. TGFβRII-/- retinae in panels (d-h) and (i,j) are from two different mutant embryos. (k,l) E18.5 > 8DIV retinal explants cultured with vehicle control (k) or TGFβRII-Fc (l) and labeled with anti-Pax6. (m) Percentage of Pax6+ amacrine cells/field in vehicle control (black bar; 2,148 Pax6+ in 10 fields) and TGFβRII-Fc treated (white bar; 4,966 Pax6+ in 15 fields) retinal explants. (n,o) E18.5→8DIV wild-type (n) or Zac1+m/- (o) retinal explants cultured with rTGFβII. Asterisk in (o) indicates ECL formation in Zac1+m/- retinae even in the presence of rTGFβII. (p) Percentage of amacrine cells in wild-type explants (black bar; vehicle control: 1,761 Pax6+/3,353 DAPI+; rTGFβII: 2,605 Pax6+/4,301 DAPI+ in INL+GCL) and Zac1+m/-+ECL explants (white bar; vehicle control: 2,232 Pax6+/3,328 DAPI+; rTGFβII: 3,243 Pax6+/5,282 DAPI+ in INL+GCL).
Figure 9
Figure 9
Model of Zac1 function in the retina. Zac1 negatively regulates amacrine cell number cell non-autonomously, controlling TGFβII expression, which inhibits amacrine cell genesis at threshold levels (negative feedback). In contrast, Zac1 negatively regulates rod number cell-autonomously. Zac1 negatively regulates (either directly or indirectly) the expression of genes involved in the specification/differentiation of an amacrine cell (Pax6, Six3, Foxn4, Math3, NeuroD, Bhlhb5, Barhl2) and rod cell (Rb, Otx2, Crx, Nr2e3, Nrl) fate by controlling the decision by retinal progenitor cells to differentiate along these lineages. AC, amacrine cell; APC, amacrine precursor cell; PPC, photoreceptor precursor cell; RPC, retinal progenitor cell.

Similar articles

Cited by

References

    1. Pearson BJ, Doe CQ. Specification of temporal identity in the developing nervous system. Annu Rev Cell Dev Biol. 2004;20:619–647. doi: 10.1146/annurev.cellbio.19.111301.115142. - DOI - PubMed
    1. Gomer RH. Not being the wrong size. Nat Rev Mol Cell Biol. 2001;2:48–54. doi: 10.1038/35048058. - DOI - PubMed
    1. Young RW. Cell differentiation in the retina of the mouse. Anat Rec. 1985;212:199–205. doi: 10.1002/ar.1092120215. - DOI - PubMed
    1. Stiemke MM, Hollyfield JG. Cell birthdays in Xenopus laevis retina. Differentiation. 1995;58:189–193. doi: 10.1046/j.1432-0436.1995.5830189.x. - DOI - PubMed
    1. Cepko CL, Austin CP, Yang X, Alexiades M, Ezzeddine D. Cell fate determination in the vertebrate retina. Proc Natl Acad Sci U S A. 1996;93:589–595. doi: 10.1073/pnas.93.2.589. - DOI - PMC - PubMed

Publication types

MeSH terms

LinkOut - more resources