

Natural lipid extracts and biomembrane-mimicking lipid compositions are disposed to form nonlamellar phases, and they release DNA from lipoplexes most efficiently
- PMID: 17559800
- PMCID: PMC2151838
- DOI: 10.1016/j.bbamem.2007.04.026
Natural lipid extracts and biomembrane-mimicking lipid compositions are disposed to form nonlamellar phases, and they release DNA from lipoplexes most efficiently
Abstract
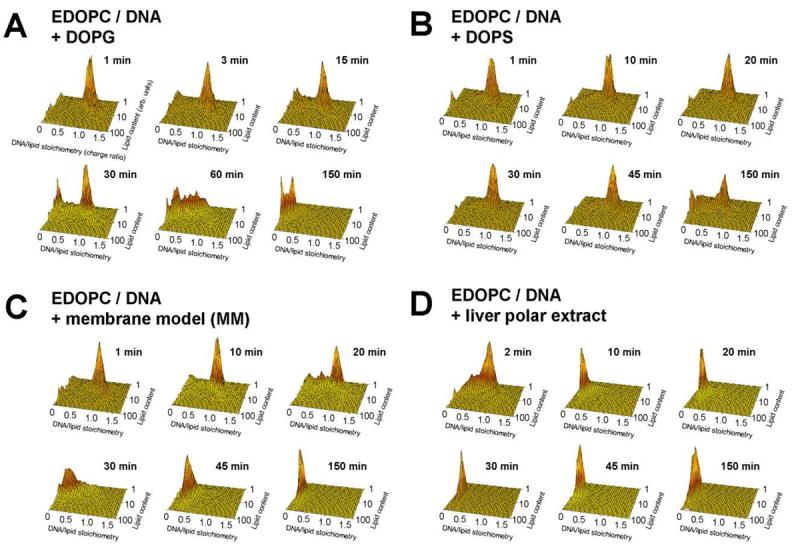
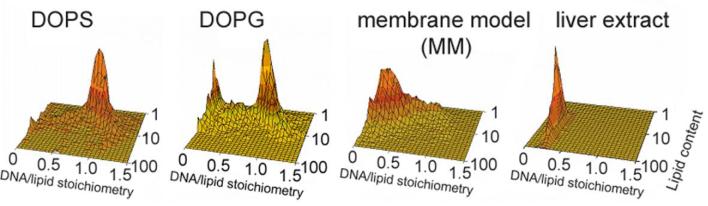
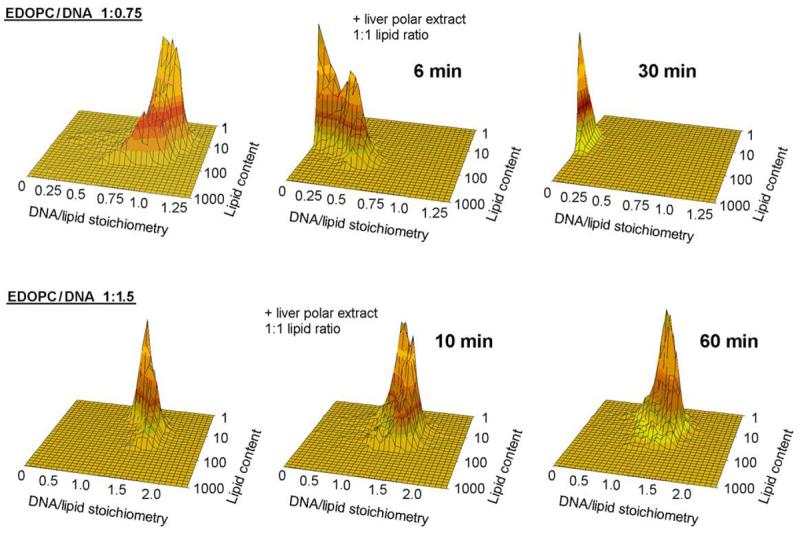
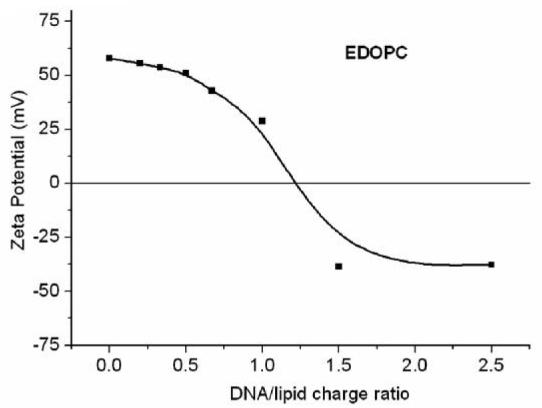
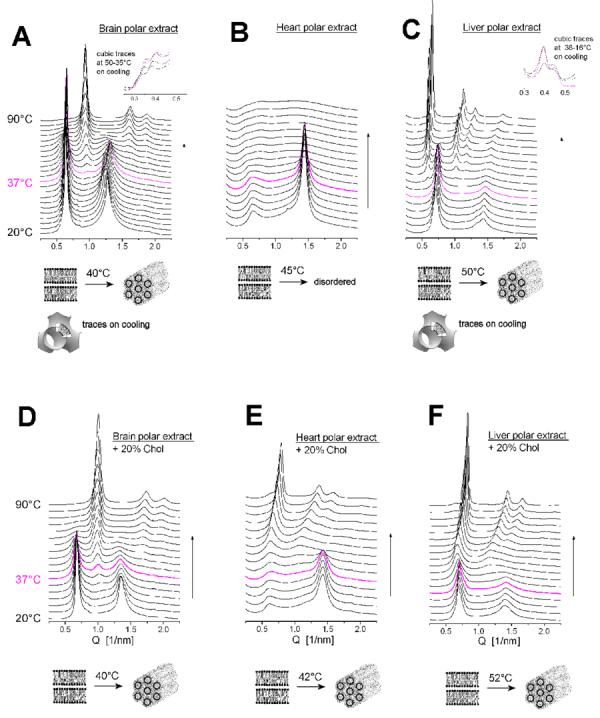
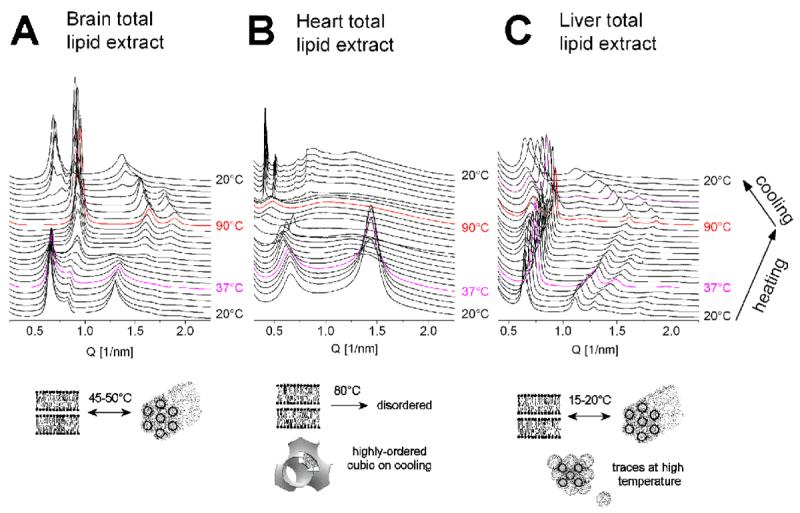
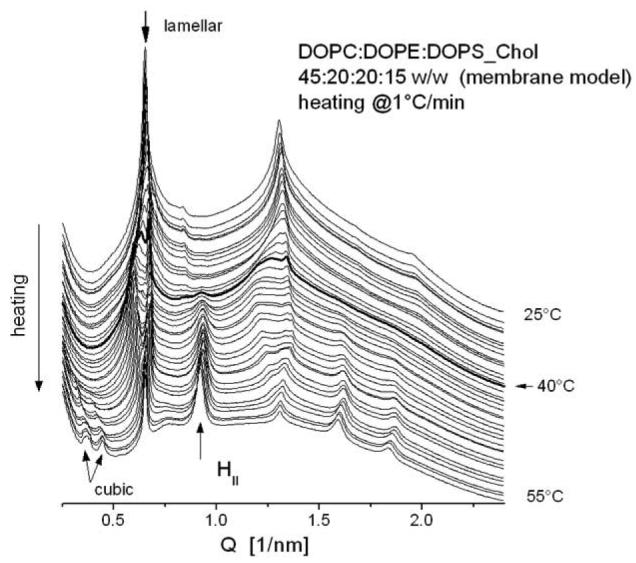
A viewpoint now emerging is that a critical factor in lipid-mediated transfection (lipofection) is the structural evolution of lipoplexes upon interacting and mixing with cellular lipids. Here we report our finding that lipid mixtures mimicking biomembrane lipid compositions are superior to pure anionic liposomes in their ability to release DNA from lipoplexes (cationic lipid/DNA complexes), even though they have a much lower negative charge density (and thus lower capacity to neutralize the positive charge of the lipoplex lipids). Flow fluorometry revealed that the portion of DNA released after a 30-min incubation of the cationic O-ethylphosphatidylcholine lipoplexes with the anionic phosphatidylserine or phosphatidylglycerol was 19% and 37%, respectively, whereas a mixture mimicking biomembranes (MM: phosphatidylcholine/phosphatidylethanolamine/phosphatidylserine /cholesterol 45:20:20:15 w/w) and polar lipid extract from bovine liver released 62% and 74%, respectively, of the DNA content. A possible reason for this superior power in releasing DNA by the natural lipid mixtures was suggested by structural experiments: while pure anionic lipids typically form lamellae, the natural lipid mixtures exhibited a surprising predilection to form nonlamellar phases. Thus, the MM mixture arranged into lamellar arrays at physiological temperature, but began to convert to the hexagonal phase at a slightly higher temperature, approximately 40-45 degrees C. A propensity to form nonlamellar phases (hexagonal, cubic, micellar) at close to physiological temperatures was also found with the lipid extracts from natural tissues (from bovine liver, brain, and heart). This result reveals that electrostatic interactions are only one of the factors involved in lipid-mediated DNA delivery. The tendency of lipid bilayers to form nonlamellar phases has been described in terms of bilayer "frustration" which imposes a nonzero intrinsic curvature of the two opposing monolayers. Because the stored curvature elastic energy in a "frustrated" bilayer seems to be comparable to the binding energy between cationic lipid and DNA, the balance between these two energies could play a significant role in the lipoplex-membrane interactions and DNA release energetics.
Figures
Similar articles
-
Toward the rational design of lipid gene vectors: shape coupling between lipoplex and anionic cellular lipids controls the phase evolution of lipoplexes and the efficiency of DNA release.ACS Appl Mater Interfaces. 2009 Oct;1(10):2237-49. doi: 10.1021/am900406b. ACS Appl Mater Interfaces. 2009. PMID: 20355858
-
Analysis of lipoplex structure and lipid phase changes.Methods Mol Biol. 2010;606:399-423. doi: 10.1007/978-1-60761-447-0_28. Methods Mol Biol. 2010. PMID: 20013412
-
An intracellular lamellar-nonlamellar phase transition rationalizes the superior performance of some cationic lipid transfection agents.Proc Natl Acad Sci U S A. 2006 Sep 26;103(39):14373-8. doi: 10.1073/pnas.0603085103. Epub 2006 Sep 18. Proc Natl Acad Sci U S A. 2006. PMID: 16983097 Free PMC article.
-
Lipid phase control of DNA delivery.Bioconjug Chem. 2005 Nov-Dec;16(6):1335-9. doi: 10.1021/bc050226x. Bioconjug Chem. 2005. PMID: 16287225 Review.
-
Exploring the promise of lipoplexes: From concept to clinical applications.Int J Pharm. 2025 Apr 15;674:125424. doi: 10.1016/j.ijpharm.2025.125424. Epub 2025 Mar 4. Int J Pharm. 2025. PMID: 40043964 Review.
Cited by
-
Liposomes for use in gene delivery.J Drug Deliv. 2011;2011:326497. doi: 10.1155/2011/326497. Epub 2010 Dec 15. J Drug Deliv. 2011. PMID: 21490748 Free PMC article.
-
Efficient escape from endosomes determines the superior efficiency of multicomponent lipoplexes.J Phys Chem B. 2009 Apr 16;113(15):4995-7. doi: 10.1021/jp811423r. J Phys Chem B. 2009. PMID: 19301832 Free PMC article.
-
Hydrophobic moiety of cationic lipids strongly modulates their transfection activity.Mol Pharm. 2009 May-Jun;6(3):951-8. doi: 10.1021/mp8002573. Mol Pharm. 2009. PMID: 19341312 Free PMC article.
-
Influence of the lamellar phase unbinding energy on the relative stability of lamellar and inverted cubic phases.Biophys J. 2008 May 15;94(10):3987-95. doi: 10.1529/biophysj.107.118034. Epub 2008 Jan 30. Biophys J. 2008. PMID: 18234828 Free PMC article.
-
Lipid Nanosystems and Serum Protein as Biomimetic Interfaces: Predicting the Biodistribution of a Caffeic Acid-Based Antioxidant.Nanotechnol Sci Appl. 2021 Feb 9;14:7-27. doi: 10.2147/NSA.S289355. eCollection 2021. Nanotechnol Sci Appl. 2021. PMID: 33603350 Free PMC article.
References
-
- Singer SJ, Nicolson GL. Fluid Mosaic Model of Structure of Cell-Membranes. Science. 1972;175:720–731. - PubMed
-
- Gulik-Krzywicki T, Rivas E, Luzzati V. Structure Et Polymorphisme Des Lipides - Etude Par Diffraction Des Rayons X Du Systeme Forme De Lipides De Mitochondries De Coeur De Boeuf Et Deau. J. Mol. Biol. 1967;27:303–322. - PubMed
-
- Luzzati V, Reiss-Husson F, Rivas E, Gulik-Krzywicki T. Structure and Polymorphism in Lipid-Water Systems and Their Possible Biological Implications. Ann. N. Y. Acad. Sci. 1966;137:409–413. - PubMed
-
- Mouritsen OG, Andersen OS, editors. In Search of a New Biomembrane Model. Munksgaard; Copenhagen: 1998.
-
- Lindblom G, Oradd G, Rilfors L, Morein S. Regulation of Lipid Composition in Acholeplasma laidlawii and Escherichia coli Membranes: NMR Studies of Lipid Lateral Diffusion at Different Growth Temperatures. Biochemistry. 2002;41:11512–11515. - PubMed
Publication types
MeSH terms
Substances
Grants and funding
LinkOut - more resources
Full Text Sources
