. 2007 Jul 16:1158:39-49.
doi: 10.1016/j.brainres.2007.05.008. Epub 2007 May 10.

alphaCaMKII autophosphorylation levels differ depending on subcellular localization

Affiliations

alphaCaMKII autophosphorylation levels differ depending on subcellular localization

Kurtis D Davies et al. Brain Res. .

Abstract

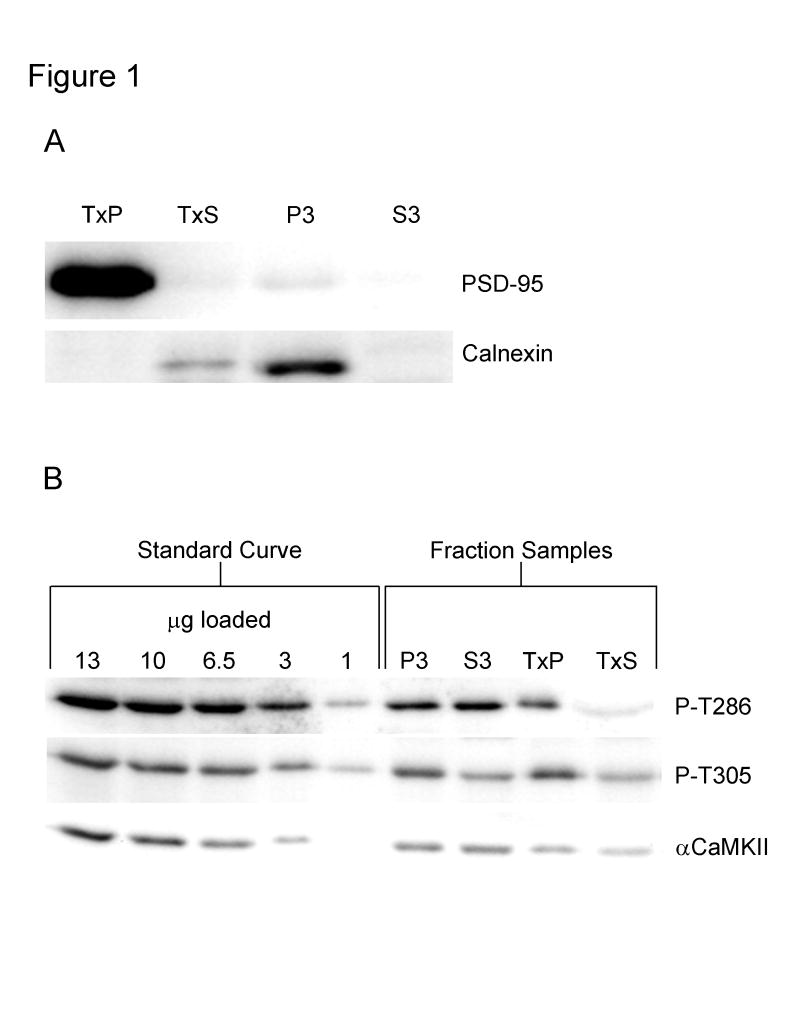
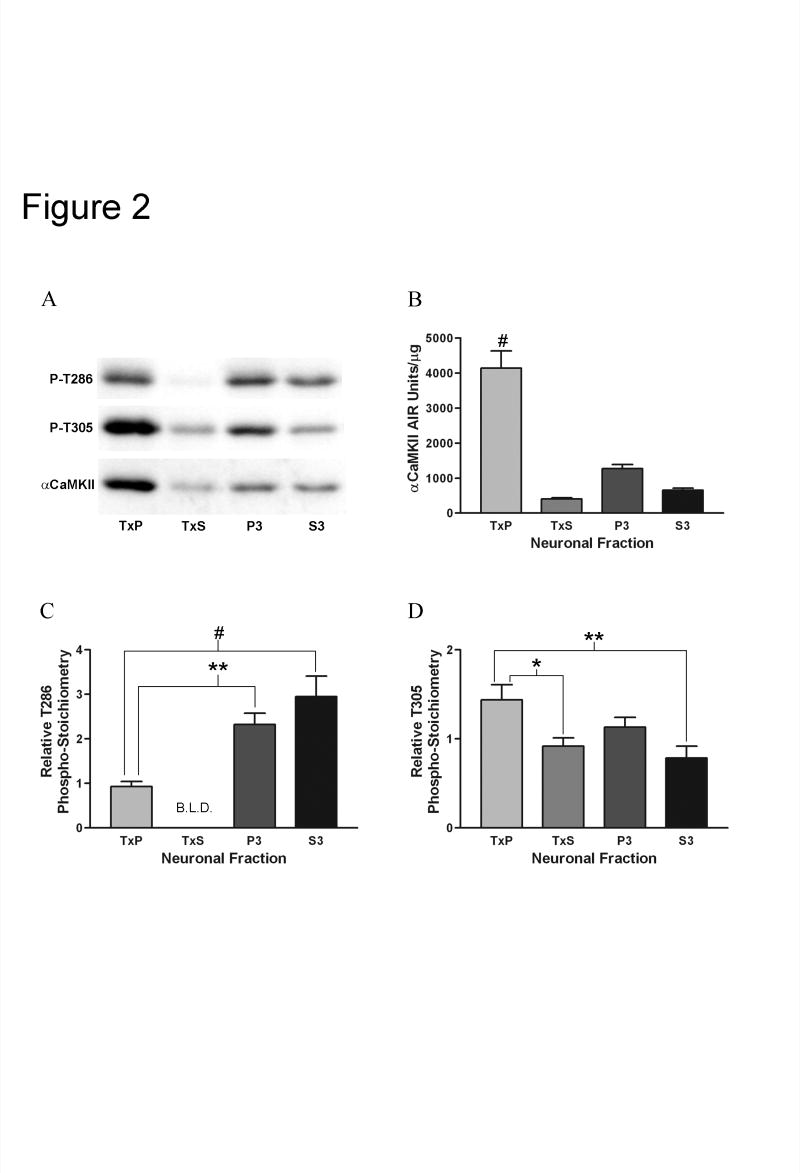
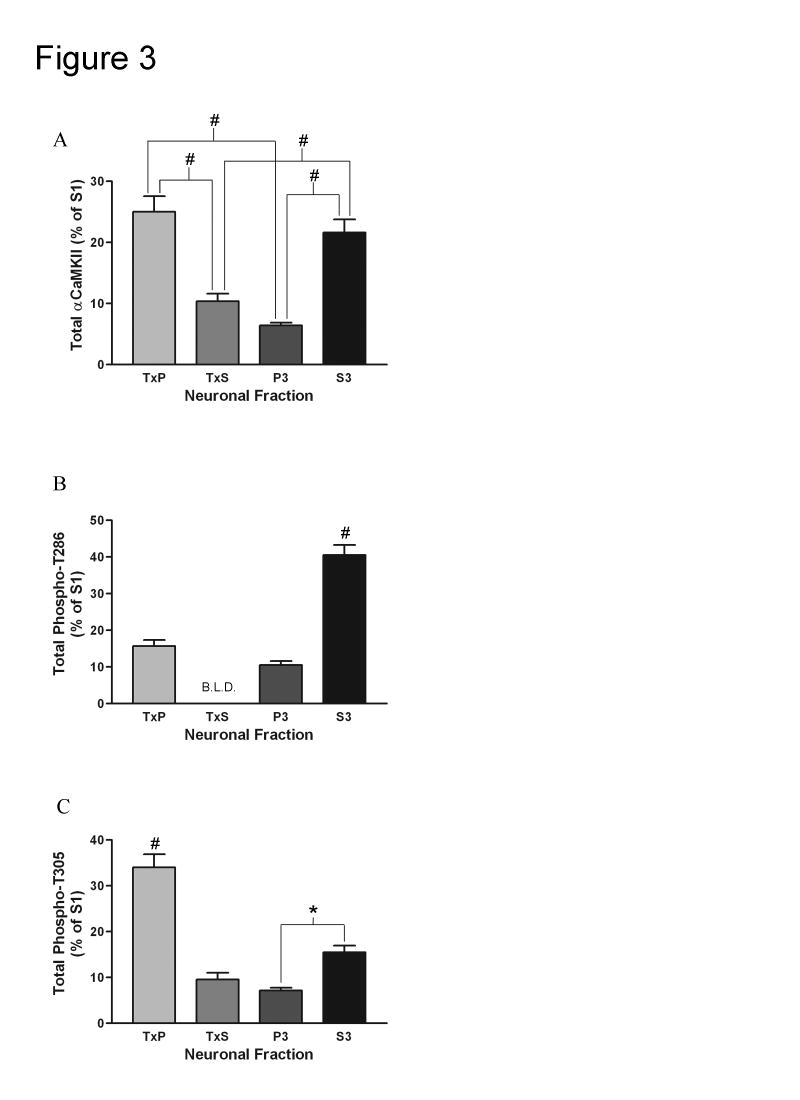
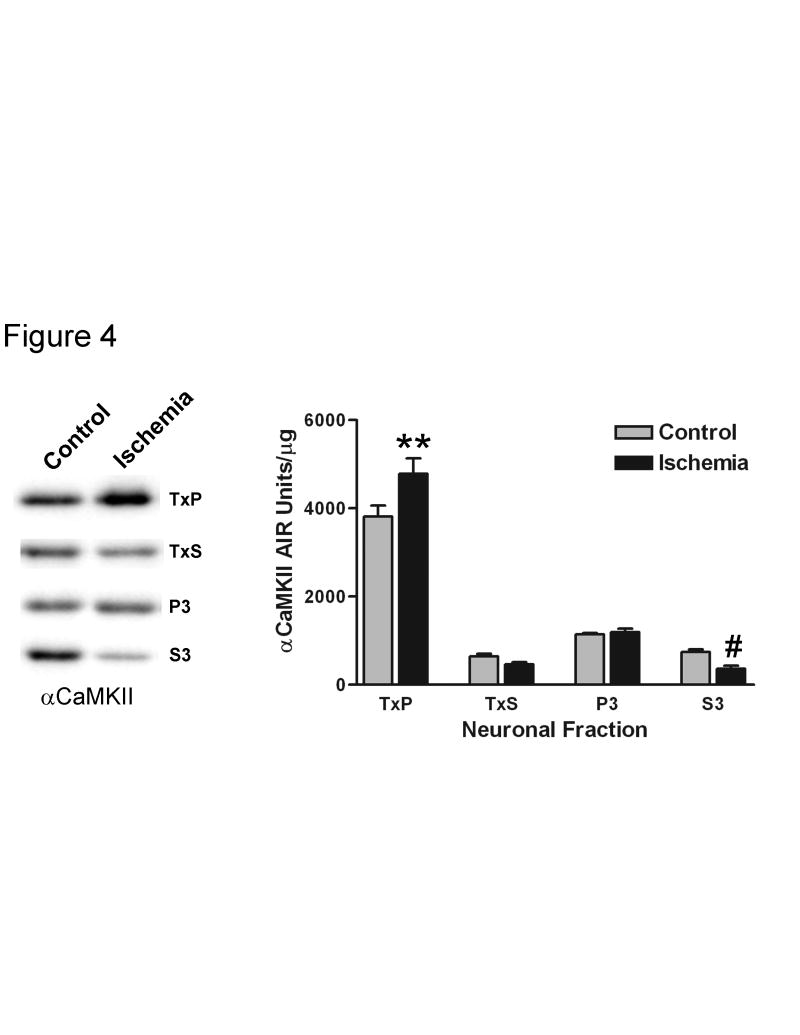
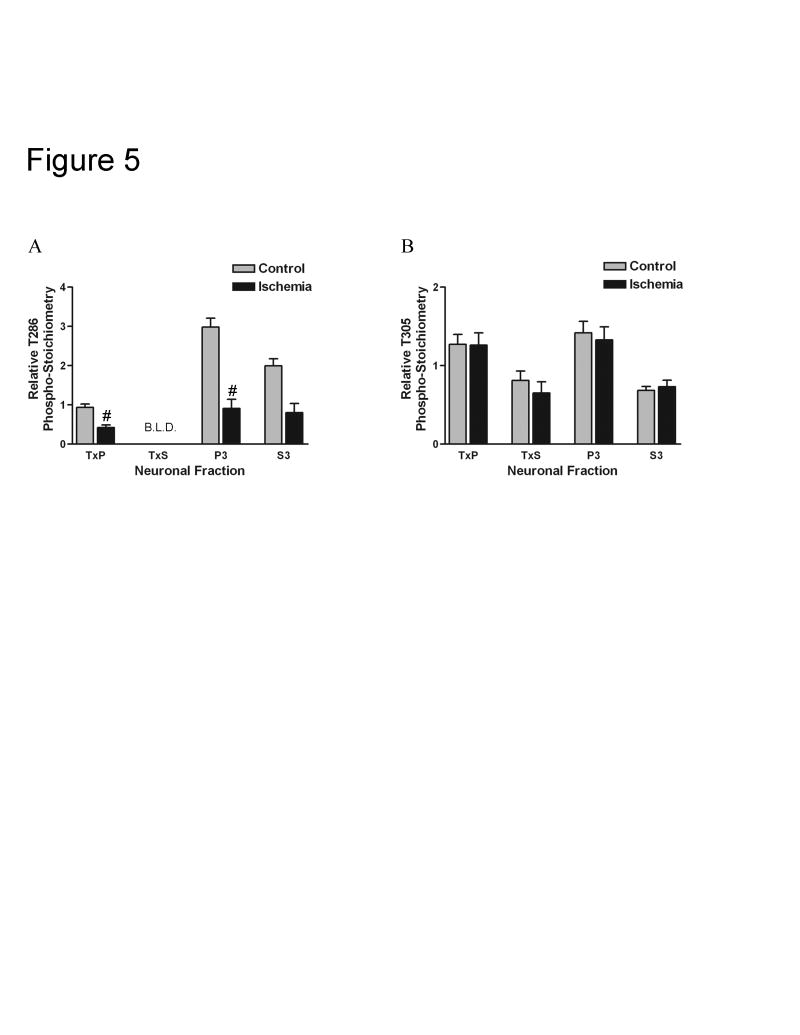
Calcium/calmodulin-dependent protein kinase II (CaMKII) has important roles in many processes in the central nervous system. It is enriched at the post-synaptic density (PSD), a localization which is thought to be critical for many of its proposed neuronal functions. In order to better understand the mechanisms that regulate association of CaMKII with the PSD, we compared the levels of autophosphorylation between PSD-associated kinase and kinase in other parts of the neuron. We were surprised to find that alphaCaMKII in a PSD-enriched fraction prepared from recovered hippocampal CA1-minislices had a relatively low level of threonine 286 (T286) phosphorylation and a relatively high level of threonine 305 (T305) phosphorylation. Furthermore, when the minislices were subjected to a treatment that mimics ischemic conditions, there was a significant translocation of alphaCaMKII to the PSD-enriched fraction accompanied with a dramatic reduction in T286 phosphorylation levels throughout the neuron. These findings have important implications for our understanding of the role of autophosphorylation in the localization of CaMKII.


Figures

Fig. 1
Fig. 1. Characterization of the subcellular fractionation procedure and semi-quantitative Western blotting
A, Western blots demonstrating the efficiency of the subcellular fractionation procedure. Recovered CA1 minislices were homogenized and subjected to the subcellular fractionation protocol. Equal amounts of total protein from each of the fractions were then analyzed by Western blot using antibodies specific for the post-synaptic density marker PSD-95 and the endoplasmic reticulum marker calnexin. TxP: PSD-enriched fraction, TxS: extra-synaptic membrane-enriched fraction, P3: microsome-enriched fraction, and S3: cytosolic fraction. B, Examples of Western blots used for semi-quantitative analysis. An identical standard curve, which contained points of 13, 10, 6.5, 3, and 1 μg of total protein, was run on each blot. Blots were labeled with an antibody specific for T286 phosphorylated αCaMKII (top blot), an antibody specific for T305 phosphorylated αCaMKII (middle blot), and a pan-αCaMKII antibody (bottom blot). For the pan-αCaMKII and P-T305 blots; 5 μg of P3, 10 μg of S3, 1.5 μg of TxP, and 12 μg of TxS were loaded. For the P-T286 blot; 1.75 μg of P3, 3.5 μg of S3, 1.5 μg of TxP, and 34 μg of TxS were loaded.
Fig. 2
Fig. 2. Comparison of the relative concentration of αCaMKII and the relative phospho-stoichiometries of T286 and T305 between the subcellular fractions under basal conditions
A, Representative Western blots with equal amounts of total protein loaded from each of the fractions and labeled with an antibody specific for T286 phosphorylated αCaMKII (top blot), an antibody specific for T305 phosphorylated αCaMKII (middle blot), and a pan-αCaMKII antibody (bottom blot). B, Quantitation of the relative concentration of αCaMKII for the TxP (n=12), TxS (n=11), P3 (n=12), and S3 (n=12) (for explanation of n see Experimental Procedure section). Bonferroni’s post-hoc analysis indicated that the TxP fraction had a significantly greater relative αCaMKII concentration than the other three fractions (#: p<0.001 for all three comparisons). C, Quantitation of the relative phospho-stoichiometry of T286 on αCaMKII for the TxP (n=12), P3 (n=12), and S3 (n=12). All bands except for one for the TxS were below the limit of linear detection (B.L.D.) when probed with the antibody specific for T286 phosphorylated αCaMKII. Since only one value was obtained for the TxS (0.073), this fraction was left out of the analysis. The relative phospho-stoichiometry for the TxP was significantly lower than the P3 (**: p<0.01) and the S3 (#: p<0.001) as determined by Bonferroni’s post-hoc analysis. D, Quantitation of the relative phospho-stoichiometry of T305 on αCaMKII for the TxP (n=12), TxS (n=11), P3 (n=12), and S3 (n=12). The relative phospho-stoichiometry for the TxP was significantly higher than the TxS (*: p<0.05) and the S3 (**: p<0.01) as determined by Bonferroni’s post-hoc analysis. Values represent the mean ± S.E.M.
Fig. 3
Fig. 3. Comparison of the total amounts of total αCaMKII, T286 phosphorylated αCaMKII, and T305 phosphorylated αCaMKII between the subcellular fractions under basal conditions
A, Quantification of the total amount (AIR units/μg x total protein concentration of fraction x volume of fraction) of total αCaMKII for the TxP (n=12), TxS (n=11), P3 (n=12), and S3 (n=12) (for explanation of n see Experimental Procedure section). Bonferroni’s post-hoc analysis indicated that the TxP contained more total αCaMKII than the TxS and P3 (#: p<0.001 for both comparisons) and the S3 contained more total αCaMKII than the TxS and P3 (#: p<0.001 for both comparisons). B, Quantification of the total amount of T286 phosphorylated αCaMKII for the TxP (n=12), P3 (n=12), and S3 (n=12). All bands except for one for the TxS were below the limit of linear detection (B.L.D.) when probed with the antibody specific for T286 phosphorylated αCaMKII (meaning that there was a very low level of T286 phosphorylated αCaMKII in this fraction). Because of this, the TxS was left out of analysis. Bonferroni’s post-hoc analysis indicated that the S3 contained significantly more T286 phosphorylated αCaMKII than the TxP and P3 (#: p<0.001 for both comparisons). C, Quantification of the total amount of T305 phosphorylated αCaMKII for the TxP (n=12), TxS (n=11), P3 (n=12), and S3 (n=12). Bonferroni’s post-hoc analysis indicated that the TxP contained more T305 phosphorylated αCaMKII than the other three fractions (#: p<0.001 for all three comparisons) and the S3 contained more T305 phosphorylated αCaMKII than the P3 (*: p<0.05). Values represent the mean ± S.E.M.
Fig. 4
Fig. 4. A 10-minute ischemic treatment followed by a 30-minute recovery alters the subcellular distribution of αCaMKII
Recovered CA1 minislices were subjected to a 10 minute anoxic/aglycemic insult (Ischemia) or kept in standard incubation conditions (Control), and then were allowed to recover in standard incubation conditions for 30 minutes. Left – individual representative Western blots with equal amounts of total protein loaded for each condition. The band on the left represents control and the band on the right represents the ischemic treatment for each fraction. Right – quantitation of the relative concentration of αCaMKII for ischemic and control conditions for the TxP (n=8), TxS (n=6), P3 (n=8), and S3 (n=8) (for explanation of n see Experimental Procedure section). Two-way ANOVA analysis indicated significant differences between the fractions (p<0.0001) but not a significant effect of the ischemic treatment (most likely because the treatment had effects in different directions depending on the fraction). Furthermore, the effect of the treatment was different among the fractions (interaction: p<0.01). Bonferroni’s post-hoc analysis indicated a significant increase in the TxP (**: p<0.01) and a significant decrease in the S3 (#: p<0.001) upon ischemic insult. Values represent the mean ± S.E.M.
Fig. 5
Fig. 5. A 10-minute ischemic treatment followed by a 30-minute recovery leads to a dramatic decrease in T286 phosphorylation throughout the neuron but no change in T305 phosphorylation
Recovered CA1 minislices were subjected to a 10 minute anoxic/aglycemic insult (Ischemia) or kept in standard incubation conditions (Control), and then were allowed to recover in standard incubation conditions for 30 minutes. A, Relative T286 phospho-stoichiometry was calculated for ischemic and control conditions for the TxP (n=8), P3 (n=8), and S3 (n=5) (for explanation of n see Experimental Procedure section). Most bands for the TxS were below the limit of linear detection (B.L.D.) when probed with the antibody specific for T286 phosphorylated αCaMKII. Relative T286 phospho-stoichiometry in the TxS could only be calculated for both ischemic and control conditions for an n=2, with means of 0.097 and 0.078, respectively. Because of this, this fraction was left out of analysis. Two-way ANOVA analysis indicated significant differences between the fractions (p<0.0001) and a significant effect of the ischemic treatment (p<0.0001). Furthermore, the effect of the treatment was different among the fractions (interaction: p<0.01). Bonferroni’s post-hoc analysis indicated a significant decrease in the TxP (#: p<0.001) and P3 (#: p<0.001) upon ischemic insult. The decrease in the S3 was large (62%), but it was not significant with an adjusted p-value. B, Relative T305 phospho-stoichiometry was calculated for ischemic and control conditions for the TxP (n=8), TxS (n=6), P3 (n=8), and S3 (n=8). Two-way ANOVA analysis indicated significant differences between the fractions (p<0.0001) but not a significant effect of the ischemic treatment. Relative T305 phospho-stoichiometry was not significantly different in any of the fractions upon ischemic insult as determined by Bonferroni’s post hoc analysis. Values represent the mean ± S.E.M.

Similar articles

Cited by

References

    1. Aronowski J, Grotta JC, Waxham MN. Ischemia-induced translocation of Ca2+/calmodulin-dependent protein kinase II: potential role in neuronal damage. J Neurochem. 1992;58:1743–1753. - PubMed
    1. Barria A, Malinow R. NMDA receptor subunit composition controls synaptic plasticity by regulating binding to CaMKII. Neuron. 2005;48:289–301. - PubMed
    1. Barria A, Muller D, Derkach V, Griffith LC, Soderling TR. Regulatory phosphorylation of AMPA-type glutamate receptors by CaM-KII during long-term potentiation. Science. 1997;276:2042–2045. - PubMed
    1. Bayer KU, De Koninck P, Leonard AS, Hell JW, Schulman H. Interaction with the NMDA receptor locks CaMKII in an active conformation. Nature. 2001;411:801–805. - PubMed
    1. Bayer KU, Lebel E, McDonald GL, O’Leary H, Schulman H, De Koninck P. Transition from reversible to persistent binding of CaMKII to postsynaptic sites and NR2B. J Neurosci. 2006;26:1164–1174. - PMC - PubMed

Publication types

Substances