Review
. 2007 Nov;56(1):1-26.
doi: 10.1016/j.brainresrev.2007.05.002. Epub 2007 May 10.

Spatial organization of direct hippocampal field CA1 axonal projections to the rest of the cerebral cortex

Affiliations
Review

Spatial organization of direct hippocampal field CA1 axonal projections to the rest of the cerebral cortex

Lee A Cenquizca et al. Brain Res Rev. 2007 Nov.

Abstract

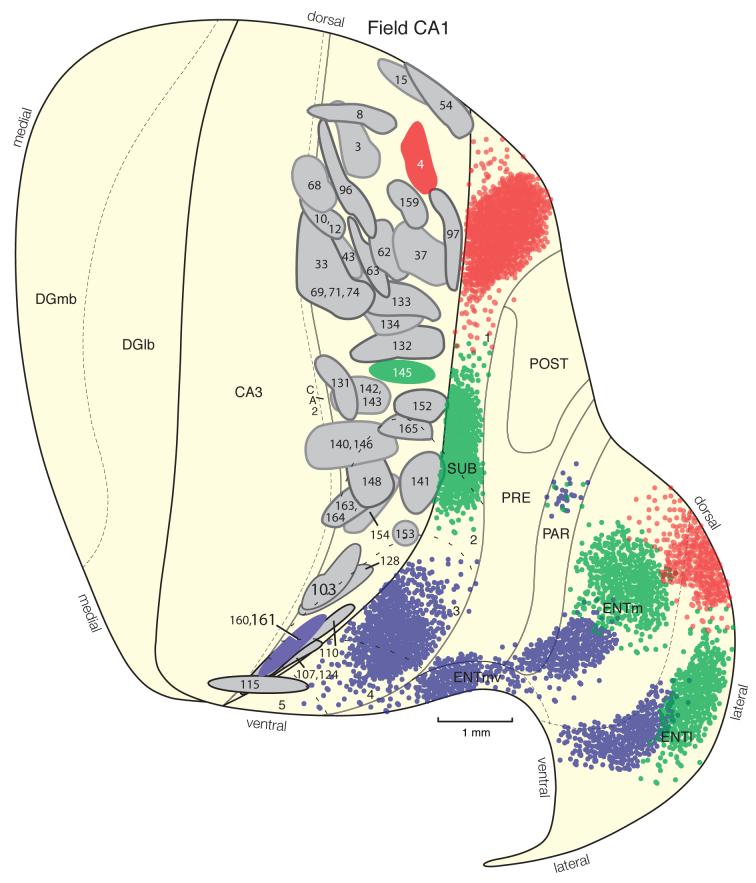
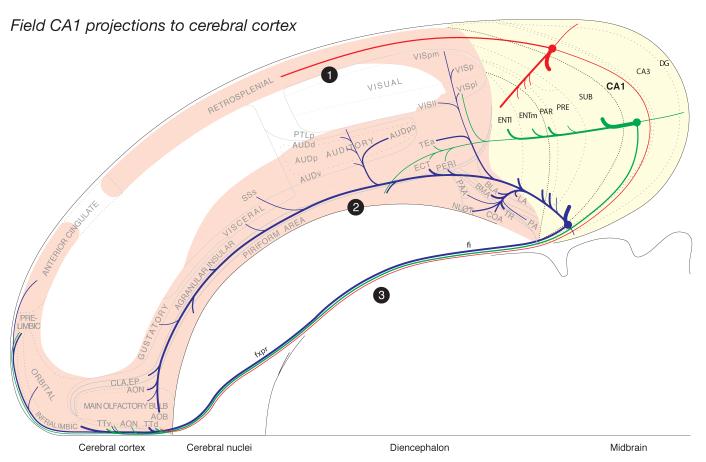
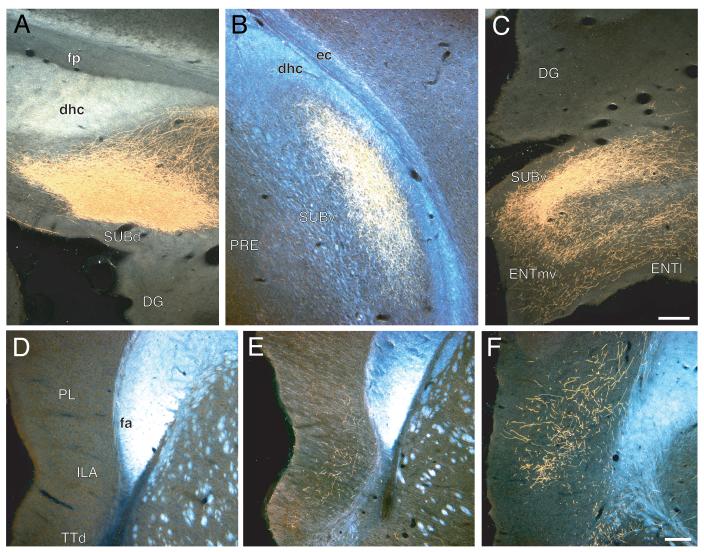
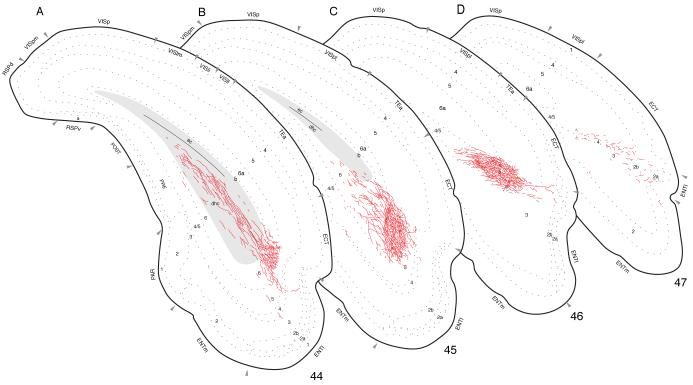
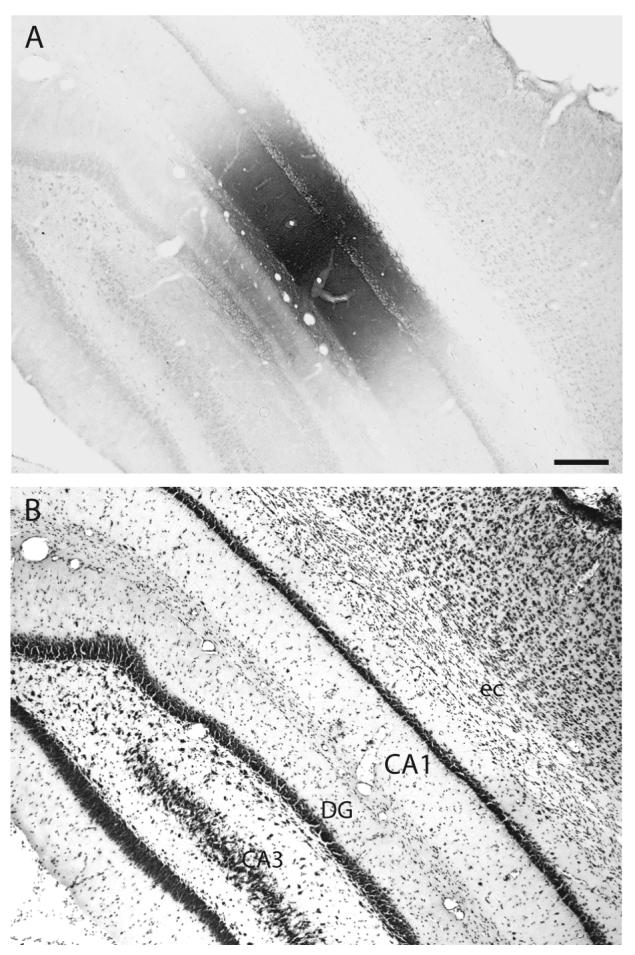
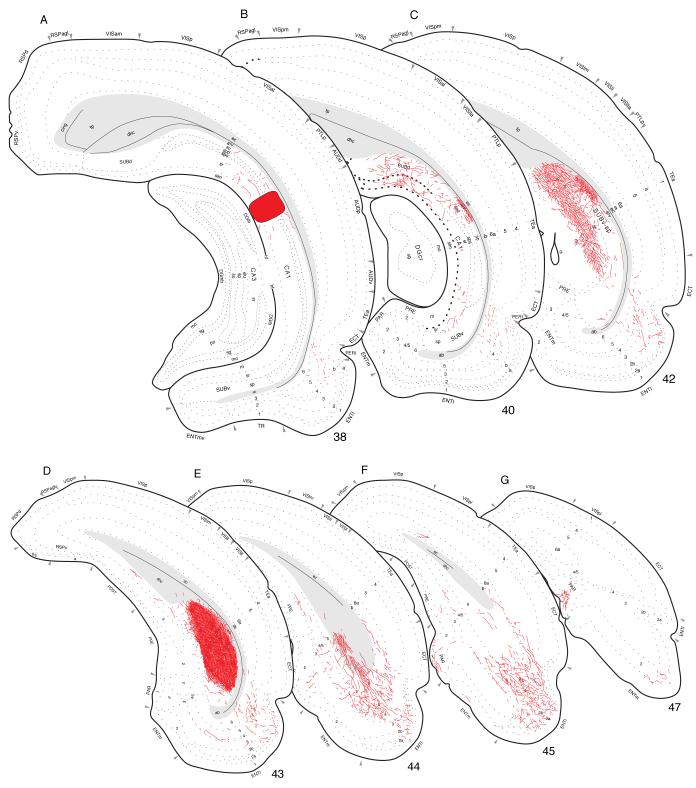
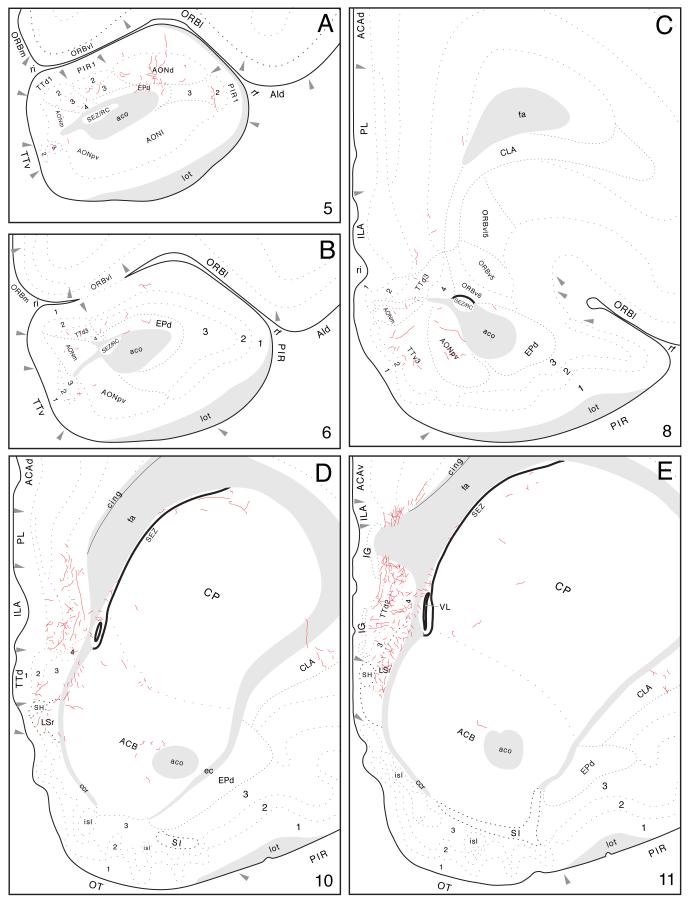
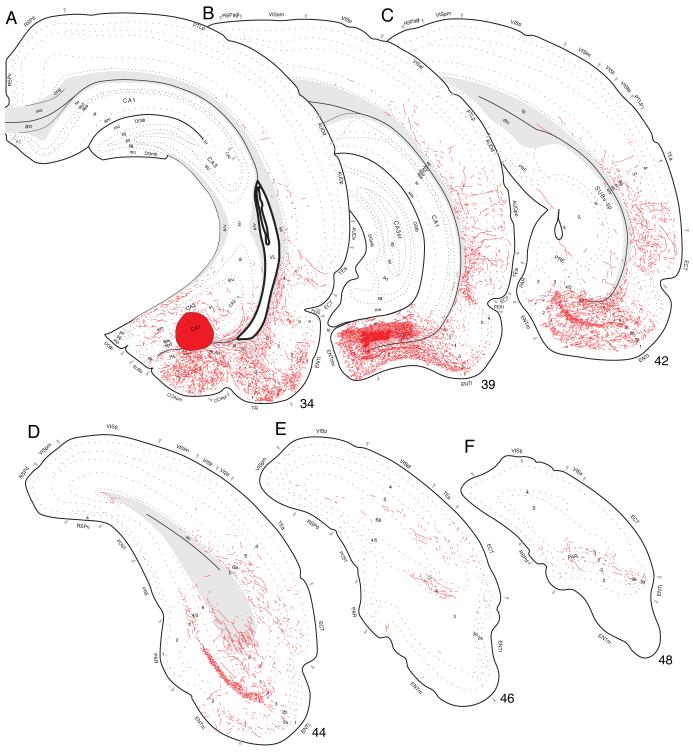
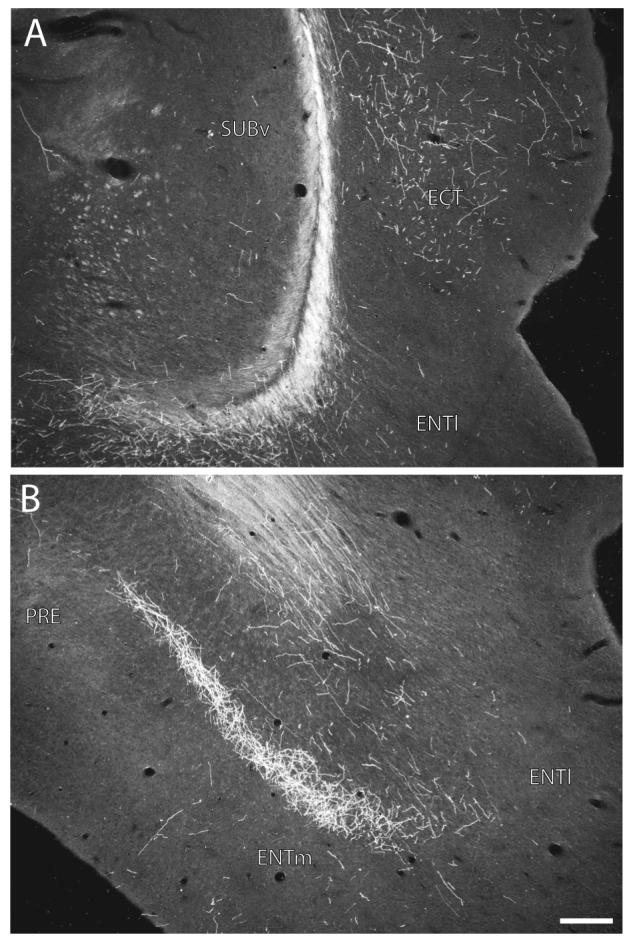
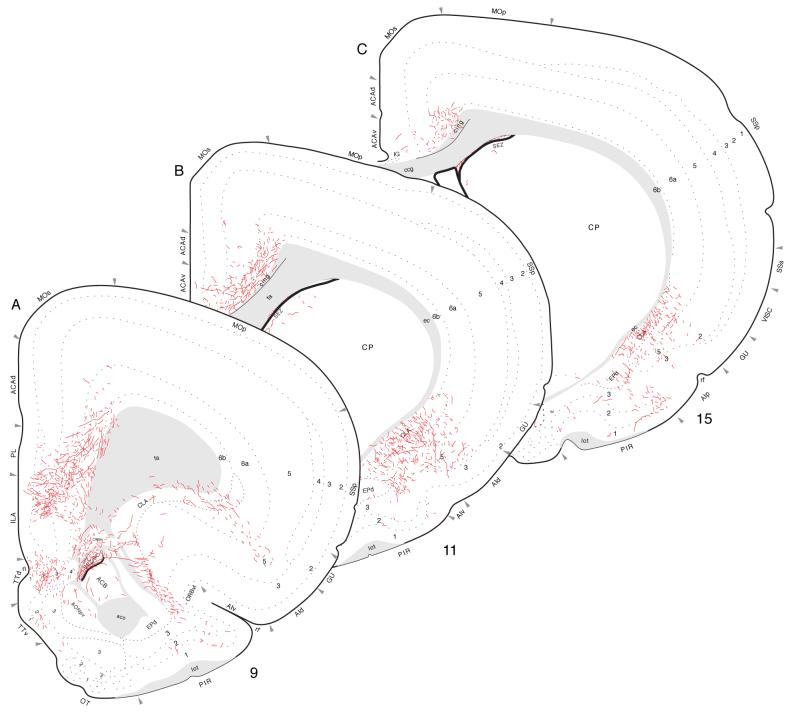
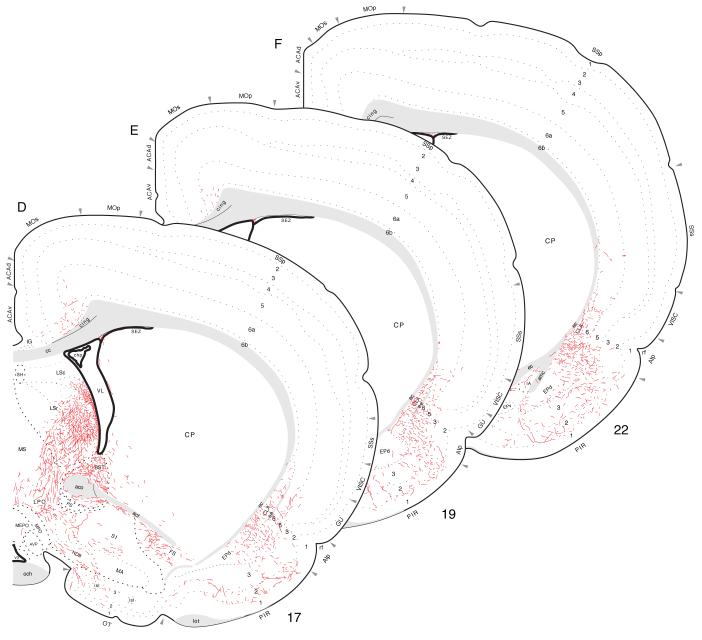
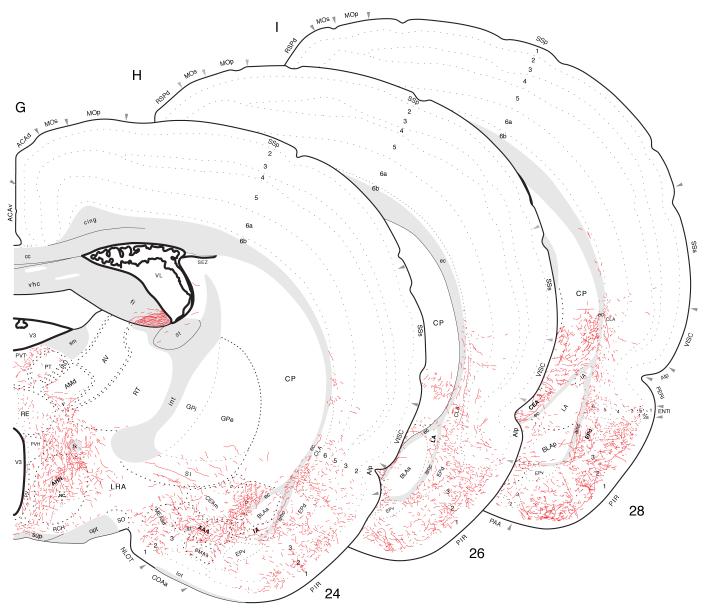
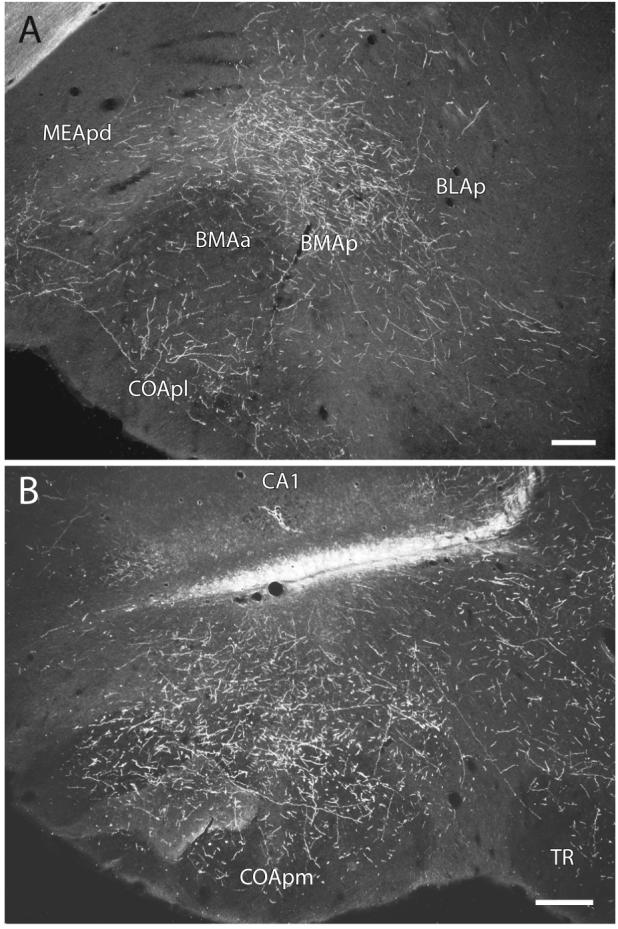
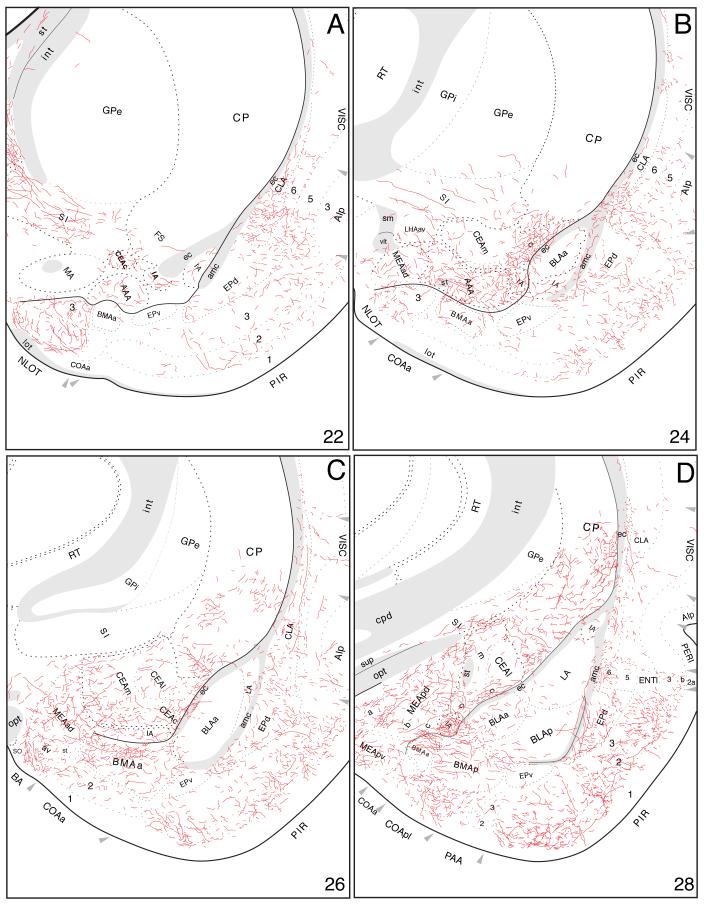
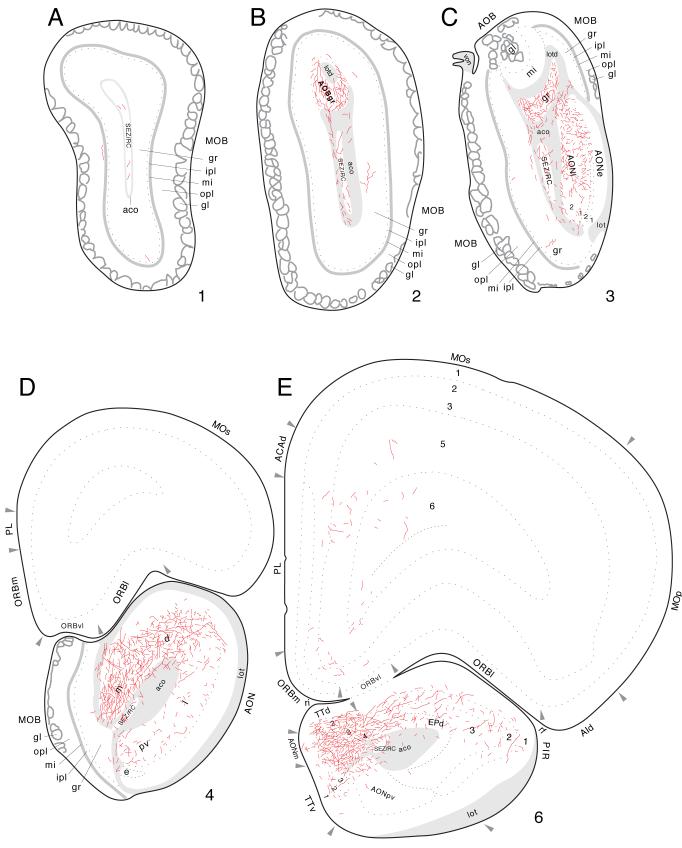
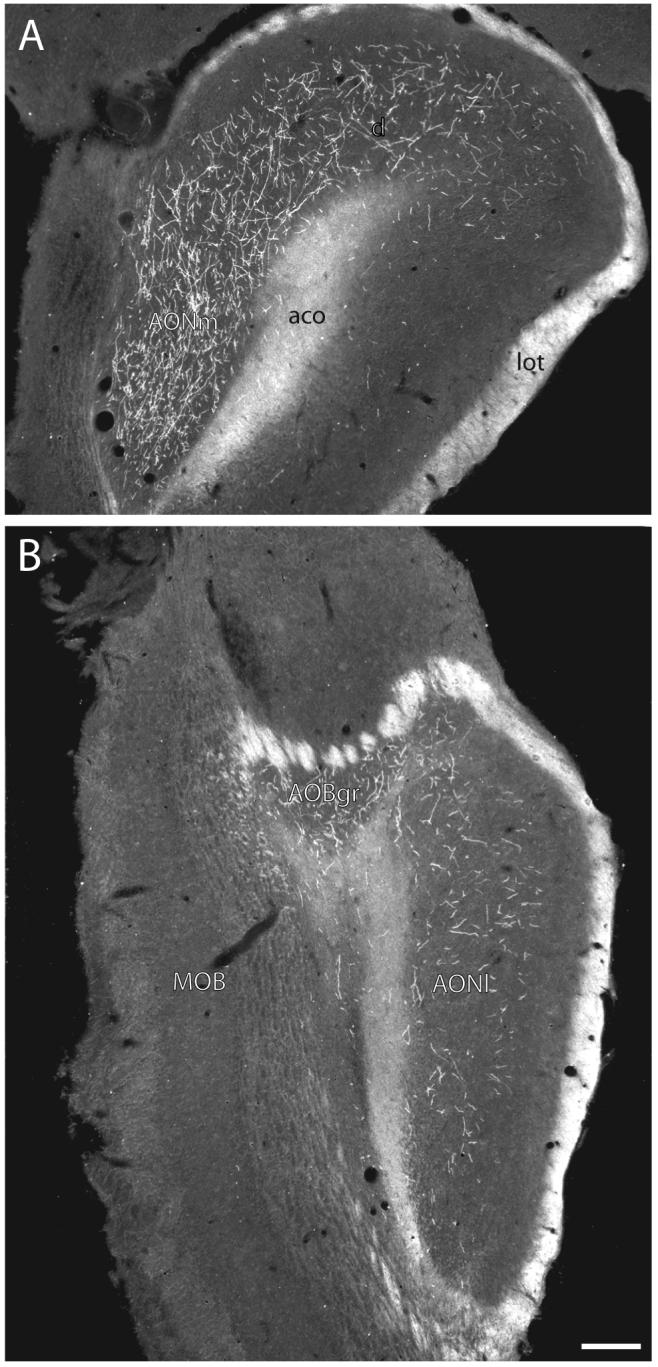
The spatial distribution of axonal projections descending from rat field CA1 to thalamus and hypothalamus was analyzed previously with the PHAL method [Cenquizca, L.A., Swanson, L.W. 2006. An analysis of direct hippocampal cortical field CA1 axonal projections to diencephalon in the rat. J Comp Neurol 497:101-114.]. The same experimental material was used here to define the topography of field CA1 association projections to other cerebral cortical areas. First, the results confirm and extend known intrahippocampal formation inputs to dentate gyrus, subiculum, presubiculum, parasubiculum, and entorhinal area, which are arranged generally along the formation's transverse axis and dominated by the subicular projection-by far the densest established by field CA1 anywhere in the brain. And second, field CA1 innervates a virtually complete ring of extrahippocampal formation cortex via three routes. A dorsal pathway from the dorsal third of field CA1 innervates moderately the retrosplenial area; a moderately strong ventral pathway from the ventral two thirds of field CA1 passing through the longitudinal association bundle sends offshoots to visual, auditory, somatosensory, gustatory, main and accessory olfactory, and visceral areas-as well as the basolateral amygdalar complex and the agranular insular and orbital areas; and a cortical-subcortical-cortical pathway through the fornix from the whole longitudinal extent of field CA1 innervates rather strongly a rostral region that includes the tenia tecta along with the anterior cingulate, prelimbic, infralimbic, and orbital areas. The functional consequences of long-term potentiation in field CA1 projection neurons remain to be explored.


Figures

Fig. 1
Fig. 1
Distribution of injection sites centered in hippocampal field CA1. Relative locations of PHAL injections from 62 experiments, plotted onto an unfolded map of the rat hippocampal formation (adapted from Petrovich et al., 2001). Three colored injection sites illustrate prototypical experiments with injection sites centered in the dorsal or septal third (red, Experiment HIPPO4), intermediate or middle levels (green, Experiment HIPPO145), and ventral or temporal pole (blue, Experiments HIPPO160 and HIPPO161) of field CA1. Note especially the inverted V shape of the field CA1 to entorhinal area projection when viewed on the flatmap.
Fig. 2
Fig. 2
Summary diagram to indicate the general organization of projections from dorsal (red), intermediate (green), and ventral (blue) levels of field CA1 to the rest of the hippocampal formation (shaded yellow), and then the rest of the cortical mantle (shaded light red). Note three general projections to the rest of the cortex: dorsal (1) to the retrosplenial area and caudal end of the anterior cingulate area, ventral (2) through the longitudinal association bundle, and rostral (3) via a cortical-subcortical-cortical pathway involving the fornix system. Projections to the diencephalon were described previously (Cenquizca and Swanson, 2006), and those to the cerebral nuclei will be described in the next contribution to this reevaluation of field CA1 efferents. The relative size of each pathway is roughly proportional to the thickness of the line representing it. The flatmap is based on Swanson (2004).
Fig. 3
Fig. 3
A: Brightfield photomicrograph illustrating the appearance and location of the PHAL injection site in Experiment HIPPO4. B: Brightfield photomicrograph of caudally adjacent thionin-stained transverse histological section. The injection site in this experiment is centered in the dorsal third of field CA1, about midway along the transverse axis at this level (see Figs. 1 and 4A). Scale = 200 μm.
Fig. 4
Fig. 4
Projections from dorsal (septal) field CA1 to parts of the hippocampal formation and retrosplenial area of the cerebral cortex. PHAL-labeled axons were plotted on a series of standard or reference drawings of the rat brain derived from an atlas (Swanson, 2004). Atlas Level (A) shows injection site location in Experiment HIPPO4 (black area; also see Figs. 1 and 3). Arranged from rostral (A) to caudal (B); the number in the lower left corner of each drawing refers to the corresponding rostrocaudal level of the atlas.
Fig. 5
Fig. 5
A-C: Darkfield photomicrographs showing the distribution of PHAL-labeled axons within the dorsal (A), intermediate or middle (B), and ventral (C) subiculum following injections centered in dorsal (Experiment HIPPO33, roughly at the level of Fig. 4B, from a different experiment), intermediate or middle (Experiment HIPPO145, roughly level of Fig. 8D), and ventral (Experiment HIPPO161, roughly level of Fig. 10B) regions of field CA1, respectively. Scale = 200 μm. D-F: Darkfield photomicrographs showing the distribution of PHAL-labeled axons within the medial prefrontal cortical region following injections centered in dorsal (D; Experiment HIPPO33), intermediate or middle (E; Experiment HIPPO145, roughly level of Fig. 9D), and ventral (F; Experiment HIPPO161, roughly level of Fig. 12A) levels of field CA1. Scale = 200 μm.
Fig. 6
Fig. 6
Projections from dorsal field CA1 to caudal regions of the cerebral cortex (Experiment HIPPO4). PHAL-labeled axons were plotted as described for Figure 4.
Fig. 7
Fig. 7
A: Brightfield photomicrograph illustrating the appearance and location of the PHAL injection site in Experiment HIPPO145 (also see Figs. 1 and 8A). B: Brightfield photomicrograph of the caudally adjacent thionin-stained transverse histological section. The injection site in this experiment is centered intermediately along the dorsoventral or longitudinal axis of field CA1 (see Fig. 1). Scale = 200 μm.
Fig. 8
Fig. 8
Projections from the middle or intermediate dorsoventral region of field CA1 to caudal regions of the cerebral cortex, plotted as described for Figure 4. The injection site for this experiment (HIPPO145; see Figs. 1 and 7) is indicated by the black filled region in panel A.
Fig. 9
Fig. 9
Projections from mid-dorsoventral regions of field CA1 to prefrontal and olfactory regions of the cerebral cortex, from Experiment HIPPO145 and plotted as described for Figure 4.
Fig. 10
Fig. 10
Projections from ventral field CA1 to caudal regions of the cerebral cortex, from Experiment HIPPO161 and plotted as described for Figure 4.
Fig. 11
Fig. 11
Darkfield photomicrographs showing the distribution of PHAL-labeled axons within the ectorhinal area of the ventral temporal region (A, about level C in Fig. 10) and the entorhinal area of the hippocampal formation (B, about level D in Fig. 10) following an injection centered in the ventral tip of field CA1 (Experiment HIPPO161, see Figs. 1 and 10A). Scale = 200 μm.
Fig. 12
Fig. 12
Projections from ventral field CA1 to cortical regions associated with the piriform area and prefrontal and insular regions, from Experiment HIPPO161 and plotted as described for Figure 4; arranged from rostral (A) to caudal (I).
Fig. 12
Fig. 12
Projections from ventral field CA1 to cortical regions associated with the piriform area and prefrontal and insular regions, from Experiment HIPPO161 and plotted as described for Figure 4; arranged from rostral (A) to caudal (I).
Fig. 12
Fig. 12
Projections from ventral field CA1 to cortical regions associated with the piriform area and prefrontal and insular regions, from Experiment HIPPO161 and plotted as described for Figure 4; arranged from rostral (A) to caudal (I).
Fig. 13
Fig. 13
Darkfield photomicrographs showing the distribution of PHAL-labeled axons within the posterior basomedial amygdalar nucleus (A) and the posteromedial cortical amygdalar nucleus (B) following an injection centered in ventral field CA1 (Experiment HIPPO161). Scale = 200 μm.
Fig. 14
Fig. 14
Projections from ventral field CA1 to the amygdalar region, with an emphasis here on those to the cortical “nuclei” and basolateral complex. The results of Experiment HIPPO161 are plotted here, as described for Figure 4.
Fig. 15
Fig. 15
Projections from ventral field CA1 to regions associated with the olfactory bulb and peduncle, from Experiment HIPPO161 and plotted as described for Figure 4; arranged from rostral (A) to caudal (E).
Fig. 16
Fig. 16
Darkfield photomicrographs showing the distribution of PHAL-labeled axons in the anterior olfactory nucleus (A, about level D in Fig. 15) and accessory olfactory bulb (B, about level C in Fig. 15) following an injection centered in ventral field CA1 (Experiment HIPPO161). Scale = 200 μm.

Similar articles

Cited by

References

    1. Acsady L, Arabadzisz D, Freund TF. Correlated morphological and neurochemical features identify different subsets of vasoactive intestinal polypeptide-immunoreactive interneurons in rat hippocampus. Neurosci. 1996;73:299–315. - PubMed
    1. Acsady L, Pascual M, Rocamora N, Soriano E, Freund TF. Nerve growth factor but not neurotrophin-3 is synthesized by hippocampal GABAergic neurons that project to the medial septum. Neurosci. 2000;98:23–31. - PubMed
    1. Adams CE, Stitzel JA, Collins AC, Freedman R. Alpha7-nicotinic receptor expression and the anatomical organization of hippocampal interneurons. Brain Res. 2001;922:180–190. - PubMed
    1. Altemus KL, Lavenex P, Ishizuka N, Amaral DG. Morphological characteristics and electrophysiological properties of CA1 pyramidal neurons in macaque monkeys. Neurosci. 2005;136:741–756. - PubMed
    1. Amaral DG, Witter MP. Hippocampal formation. In: Paxinos G, editor. The rat nervous system. Academic Press; San Diego: 1995. pp. 443–493.

Publication types

MeSH terms

Substances

LinkOut - more resources