

Scale-invariance of receptive field properties in primary visual cortex
- PMID: 17562009
- PMCID: PMC1913534
- DOI: 10.1186/1471-2202-8-38
Scale-invariance of receptive field properties in primary visual cortex
Abstract
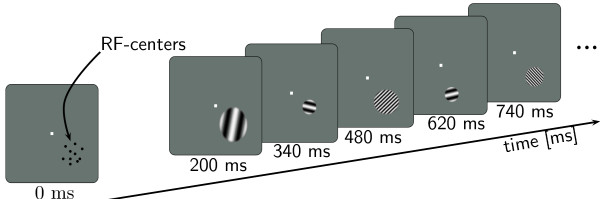
Background: Our visual system enables us to recognize visual objects across a wide range of spatial scales. The neural mechanisms underlying these abilities are still poorly understood. Size- or scale-independent representation of visual objects might be supported by processing in primary visual cortex (V1). Neurons in V1 are selective for spatial frequency and thus represent visual information in specific spatial wavebands. We tested whether different receptive field properties of neurons in V1 scale with preferred spatial wavelength. Specifically, we investigated the size of the area that enhances responses, i.e., the grating summation field, the size of the inhibitory surround, and the distance dependence of signal coupling, i.e., the linking field.
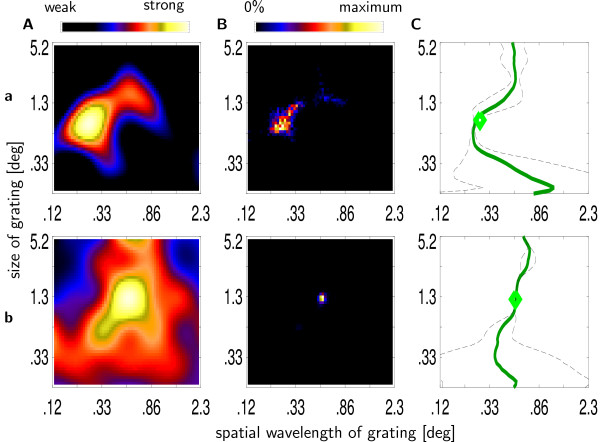
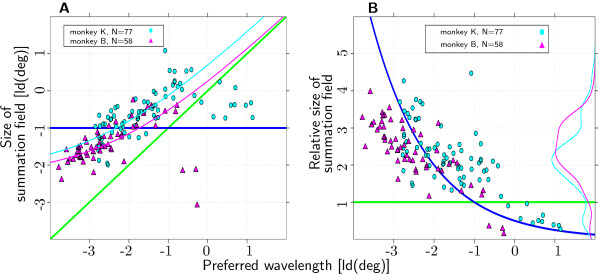
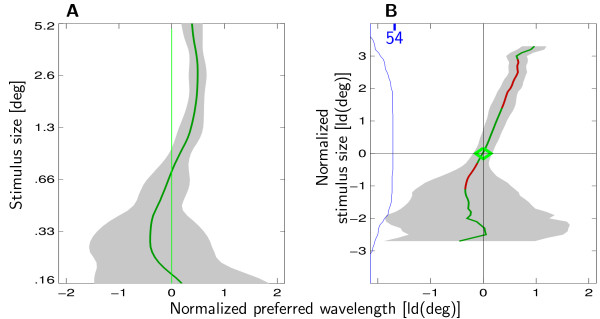
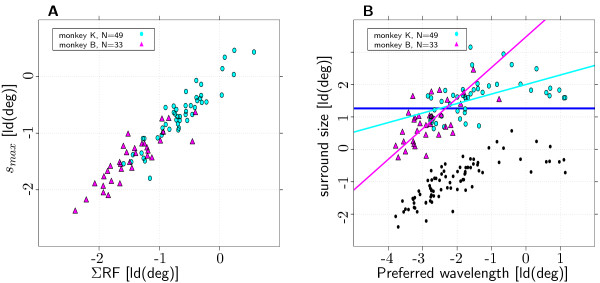
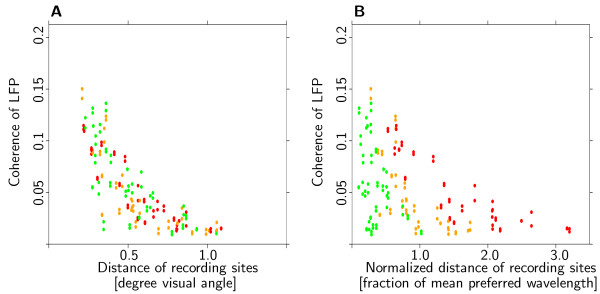
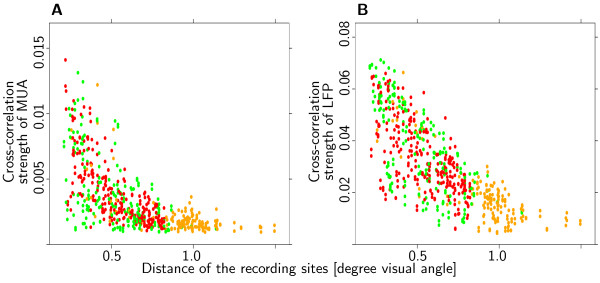
Results: We found that the sizes of both grating summation field and inhibitory surround increase with preferred spatial wavelength. For the summation field this increase, however, is not strictly linear. No evidence was found that size of the linking field depends on preferred spatial wavelength.
Conclusion: Our data show that some receptive field properties are related to preferred spatial wavelength. This speaks in favor of the hypothesis that processing in V1 supports scale-invariant aspects of visual performance. However, not all properties of receptive fields in V1 scale with preferred spatial wavelength. Spatial-wavelength independence of the linking field implies a constant spatial range of signal coupling between neurons with different preferred spatial wavelengths. This might be important for encoding extended broad-band visual features such as edges.
Figures
Similar articles
-
Selectivity and spatial distribution of signals from the receptive field surround in macaque V1 neurons.J Neurophysiol. 2002 Nov;88(5):2547-56. doi: 10.1152/jn.00693.2001. J Neurophysiol. 2002. PMID: 12424293
-
Orientation tuning of surround suppression in lateral geniculate nucleus and primary visual cortex of cat.Neuroscience. 2007 Nov 23;149(4):962-75. doi: 10.1016/j.neuroscience.2007.08.001. Epub 2007 Aug 9. Neuroscience. 2007. PMID: 17945429
-
Contrast's effect on spatial summation by macaque V1 neurons.Nat Neurosci. 1999 Aug;2(8):733-9. doi: 10.1038/11197. Nat Neurosci. 1999. PMID: 10412063
-
The contribution of vertical and horizontal connections to the receptive field center and surround in V1.Neural Netw. 2004 Jun-Jul;17(5-6):681-93. doi: 10.1016/j.neunet.2004.05.002. Neural Netw. 2004. PMID: 15288892 Review.
-
Space reconstruction by primary visual cortex activity: a parallel, non-computational mechanism of object representation.Trends Neurosci. 2015 Apr;38(4):207-16. doi: 10.1016/j.tins.2015.02.005. Trends Neurosci. 2015. PMID: 25839087 Review.
Cited by
-
Contextual processing in unpredictable auditory environments: the limited resource model of auditory refractoriness in the rhesus.J Neurophysiol. 2016 Nov 1;116(5):2125-2139. doi: 10.1152/jn.00419.2016. Epub 2016 Aug 10. J Neurophysiol. 2016. PMID: 27512021 Free PMC article.
-
Anatomy and Physiology of Macaque Visual Cortical Areas V1, V2, and V5/MT: Bases for Biologically Realistic Models.Cereb Cortex. 2020 May 18;30(6):3483-3517. doi: 10.1093/cercor/bhz322. Cereb Cortex. 2020. PMID: 31897474 Free PMC article. Review.
-
Neural computation of visual imaging based on Kronecker product in the primary visual cortex.BMC Neurosci. 2010 Mar 26;11:43. doi: 10.1186/1471-2202-11-43. BMC Neurosci. 2010. PMID: 20346118 Free PMC article.
-
The divisive normalization model of V1 neurons: a comprehensive comparison of physiological data and model predictions.J Neurophysiol. 2017 Dec 1;118(6):3051-3091. doi: 10.1152/jn.00821.2016. Epub 2017 Aug 23. J Neurophysiol. 2017. PMID: 28835531 Free PMC article. Review.
-
Inferring the direction of implied motion depends on visual awareness.J Vis. 2014 Apr 4;14(4):4. doi: 10.1167/14.4.4. J Vis. 2014. PMID: 24706951 Free PMC article.
References
-
- De Valois R, Albrecht D, Thorell L. Frontiers in visual science, ”Cortical cells: Bar and edge detectors, or spatial frequency filters”. Springer, New York 1978 chap;
Publication types
MeSH terms
LinkOut - more resources
Full Text Sources
