Transcriptome changes and cAMP oscillations in an archaeal cell cycle
- PMID: 17562013
- PMCID: PMC1906763
- DOI: 10.1186/1471-2121-8-21
Transcriptome changes and cAMP oscillations in an archaeal cell cycle
Abstract
Background: The cell cycle of all organisms includes mass increase by a factor of two, replication of the genetic material, segregation of the genome to different parts of the cell, and cell division into two daughter cells. It is tightly regulated and typically includes cell cycle-specific oscillations of the levels of transcripts, proteins, protein modifications, and signaling molecules. Until now cell cycle-specific transcriptome changes have been described for four eukaryotic species ranging from yeast to human, but only for two prokaryotic species. Similarly, oscillations of small signaling molecules have been identified in very few eukaryotic species, but not in any prokaryote.
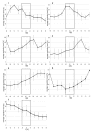
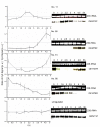
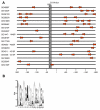
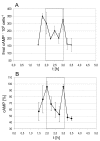
Results: A synchronization procedure for the archaeon Halobacterium salinarum was optimized, so that nearly 100% of all cells divide in a time interval that is 1/4th of the generation time of exponentially growing cells. The method was used to characterize cell cycle-dependent transcriptome changes using a genome-wide DNA microarray. The transcript levels of 87 genes were found to be cell cycle-regulated, corresponding to 3% of all genes. They could be clustered into seven groups with different transcript level profiles. Cluster-specific sequence motifs were detected around the start of the genes that are predicted to be involved in cell cycle-specific transcriptional regulation. Notably, many cell cycle genes that have oscillating transcript levels in eukaryotes are not regulated on the transcriptional level in H. salinarum. Synchronized cultures were also used to identify putative small signaling molecules. H. salinarum was found to contain a basal cAMP concentration of 200 microM, considerably higher than that of yeast. The cAMP concentration is shortly induced directly prior to and after cell division, and thus cAMP probably is an important signal for cell cycle progression.
Conclusion: The analysis of cell cycle-specific transcriptome changes of H. salinarum allowed to identify a strategy of transcript level regulation that is different from all previously characterized species. The transcript levels of only 3% of all genes are regulated, a fraction that is considerably lower than has been reported for four eukaryotic species (6%-28%) and for the bacterium C. crescentus (19%). It was shown that cAMP is present in significant concentrations in an archaeon, and the phylogenetic profile of the adenylate cyclase indicates that this signaling molecule is widely distributed in archaea. The occurrence of cell cycle-dependent oscillations of the cAMP concentration in an archaeon and in several eukaryotic species indicates that cAMP level changes might be a phylogenetically old signal for cell cycle progression.
Figures


Similar articles
-
Regulated polyploidy in halophilic archaea.PLoS One. 2006 Dec 20;1(1):e92. doi: 10.1371/journal.pone.0000092. PLoS One. 2006. PMID: 17183724 Free PMC article.
-
Cell cycle-dependent expression of an essential SMC-like protein and dynamic chromosome localization in the archaeon Halobacterium salinarum.Mol Microbiol. 2002 Oct;46(2):395-409. doi: 10.1046/j.1365-2958.2002.03181.x. Mol Microbiol. 2002. PMID: 12406217
-
Archaeal cell cycle progress.Curr Opin Microbiol. 2005 Dec;8(6):662-8. doi: 10.1016/j.mib.2005.10.008. Epub 2005 Oct 24. Curr Opin Microbiol. 2005. PMID: 16249118 Review.
-
Global analysis of mRNA decay in Halobacterium salinarum NRC-1 at single-gene resolution using DNA microarrays.J Bacteriol. 2007 Oct;189(19):6936-44. doi: 10.1128/JB.00559-07. Epub 2007 Jul 20. J Bacteriol. 2007. PMID: 17644597 Free PMC article.
-
Multiple origins of replication in archaea.Trends Microbiol. 2004 Sep;12(9):399-401. doi: 10.1016/j.tim.2004.07.001. Trends Microbiol. 2004. PMID: 15337158 Review.
Cited by
-
Generation and phenotyping of a collection of sRNA gene deletion mutants of the haloarchaeon Haloferax volcanii.PLoS One. 2014 Mar 17;9(3):e90763. doi: 10.1371/journal.pone.0090763. eCollection 2014. PLoS One. 2014. PMID: 24637842 Free PMC article.
-
Polyploidy in haloarchaea: advantages for growth and survival.Front Microbiol. 2014 Jun 13;5:274. doi: 10.3389/fmicb.2014.00274. eCollection 2014. Front Microbiol. 2014. PMID: 24982654 Free PMC article. Review.
-
Functional diversity of nanohaloarchaea within xylan-degrading consortia.Front Microbiol. 2023 May 31;14:1182464. doi: 10.3389/fmicb.2023.1182464. eCollection 2023. Front Microbiol. 2023. PMID: 37323909 Free PMC article.
-
A Haloarchaeal Small Regulatory RNA (sRNA) Is Essential for Rapid Adaptation to Phosphate Starvation Conditions.Front Microbiol. 2019 Jun 5;10:1219. doi: 10.3389/fmicb.2019.01219. eCollection 2019. Front Microbiol. 2019. PMID: 31231327 Free PMC article.
-
Activation of SsoPK4, an Archaeal eIF2α Kinase Homolog, by Oxidized CoA.Proteomes. 2015 May 15;3(2):89-116. doi: 10.3390/proteomes3020089. Proteomes. 2015. PMID: 28248264 Free PMC article.
References
-
- Lundgren M, Bernander R. Archaeal cell cycle progress. Curr Opin Microbiol. 2005;8:662–668. - PubMed
Publication types
MeSH terms
Substances
LinkOut - more resources
Full Text Sources

