. 2007 Jun 18;177(6):1017-27.
doi: 10.1083/jcb.200702101. Epub 2007 Jun 11.

A novel role in cytokinesis reveals a housekeeping function for the unfolded protein response

Affiliations

A novel role in cytokinesis reveals a housekeeping function for the unfolded protein response

Alicia A Bicknell et al. J Cell Biol. .

Abstract

The unfolded protein response (UPR) pathway helps cells cope with endoplasmic reticulum (ER) stress by activating genes that increase the ER's functional capabilities. We have identified a novel role for the UPR pathway in facilitating budding yeast cytokinesis. Although other cell cycle events are unaffected by conditions that disrupt ER function, cytokinesis is sensitive to these conditions. Moreover, efficient cytokinesis requires the UPR pathway even during unstressed growth conditions. UPR-deficient cells are defective in cytokinesis, and cytokinesis mutants activate the UPR. The UPR likely achieves its role in cytokinesis by sensing small changes in ER load and making according changes in ER capacity. We propose that cytokinesis is one of many cellular events that require a subtle increase in ER function and that the UPR pathway has a previously uncharacterized housekeeping role in maintaining ER plasticity during normal cell growth.


Figures

Figure 1.
Figure 1.
HAC1 mRNA splicing occurs during unstressed growth. Wild-type cells (MNY1002) were treated with 1 μg/ml Tm for 1.5 h to induce UPR. 10 μg RNA were loaded on a Northern gel (lane 1). Indicated amounts of RNA from untreated asynchronous wild-type (MNY1002) cells (lanes 2–6) and ire1Δ (MNY1011) cells (lanes 7–11) were loaded on a Northern gel. The gel was probed with a HAC1-specific probe to detect unspliced (U) and spliced (S) forms. The arrow indicates the presence of spliced HAC1 in the unstressed sample.
Figure 2.
Figure 2.
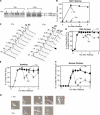
ero1-1 cells are delayed in the cell cycle with high DNA content, large buds, and divided nuclei. Wild-type (MNY1002) and ero1-1 (MNY1003) cells were shifted to 37°C after α-factor synchronization and 25 min of recovery at 25°C. The 25 min after α-factor removal prevented cells from undergoing the heat-specific G1/S phase delay that was observed in asynchronous experiments (Fig. S2, available at http://www.jcb.org/cgi/content/full/jcb.200702101/DC1), thus allowing the examination of subsequent ER-specific cell cycle effects. (A) Schematic representation of the experiment. Note that the 0-h time point is defined as the time of shifting to 37°C growth. (B) Northern analysis with a HAC1-specific probe shows the conversion of unspliced HAC1 mRNA (U) to spliced HAC1 mRNA (S) in ero1-1 cells experiencing ER stress upon growth at 37°C. (C) Quantitation of B calculated as spliced HAC1 mRNA divided by total HAC1 mRNA. (D) Flow cytometric analysis of cells stained with Sytox green, a fluorescent dye that binds DNA quantitatively and emits fluorescence with an intensity corresponding to cellular DNA content (Haase and Reed, 2002). The first peak in the histogram (indicated as 1C) represents prereplication cells, and the second peak (2C) represents postreplication cells. The appearance of 3C and 4C cells is represented by a third and fourth peak. (E) Quantitation from D of the percentage of cells in the population that contained 2C or greater DNA content combined. (F) 200 cells per time point were scored as + or − bud. The graph represents the percentage of total cells that contained a bud. (G) Cells were stained with DAPI to visualize nuclei, and 200 cells per time point were scored as + or − divided nuclei. The graph represents the percentage of total cells that contained divided nuclei. (H) Cells were stained with DAPI. The red arrow indicates an additional bud. All error bars represent the SD of three repeats.
Figure 3.
Figure 3.
Tm-treated cells are delayed in the cell cycle with high DNA content, large buds, and divided nuclei. Wild-type (MNY1005) cells were synchronized with α factor and treated with +/− Tm 30 min after α-factor release (Fig. S3, available at http://www.jcb.org/cgi/content/full/jcb.200702101/DC1). Indicated time points refer to time after α-factor release. (A) Northern analysis with a HAC1-specific probe shows the conversion of unspliced HAC1 mRNA (U) to spliced HAC1 mRNA (S) in cells experiencing ER stress. (B) Quantitation of A calculated as spliced HAC1 mRNA divided by total HAC1 mRNA. (C) Flow cytometric analysis of cells stained with Sytox green to measure DNA content. The arrow indicates the appearance of 3C cells. (D) Quantitation from C of the percentage of cells in the population that contained 2C or greater DNA content. (E) Percentage of total cells that were budded during synchronized growth +/– Tm. (F) Percentage of total cells that contained divided nuclei with properly segregated sister chromatids during synchronized growth +/− Tm. (G) Pictures show DAPI-stained nuclei (blue) and GFP-marked sister chromatids (indicated by white arrows). The red arrow indicates an additional bud. All error bars represent the SD of three repeats. The 15-min difference in wild-type cell division time (1.25 vs. 1.5 h), as assayed by flow cytometry versus the budding index (compare B with C), is likely the result of differences in the cell fixing protocol for the different assays (see Materials and methods).
Figure 4.
Figure 4.
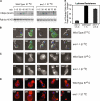
Ero1p inactivation causes cytokinesis delay. (A–D) Experiments were performed according to the schematic in Fig. 1 A, and cells were collected for immunoblot analysis, probing for Pgk1p (loading control) and Clb2p (A), Cdc14p-GFP visualization (B), Tub1p-GFP visualization (C), and AlexaFluor546-phalloidin staining to visualize actin patch localization (D). Blue indicates DAPI staining. Bars, 2 μm. (E) Wild-type (MNY1002), cts1Δ (MNY1012), and ero1-1 (MNY1003) cells were α-factor synchronized and released at 30 (wild type and cts1Δ) or 37°C (ero1-1). Cells were grown for the indicated times, and α factor was added back to the medium to prevent second cell cycle initiation. Cells were fixed, and the budding index was calculated before and after lyticase treatment. The graph depicts lyticase resistance, which was calculated as the budding index after lyticase treatment divided by the budding index before lyticase treatment. Error bars represent the SD of three repeats.
Figure 5.
Figure 5.
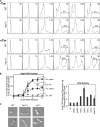
UPR signaling facilitates cytokinesis during normal cell growth. (A) Wild-type (MNY1002) and hac1Δ (MNY1010) cells were treated with +/− Tm 30 min after α-factor release. Cells were fixed, stained with Sytox green, and analyzed by flow cytometry. Bars define a subpopulation of high DNA content cells, and the given numbers indicate percentages of the total live cell population that has a high DNA content. (B) Quantitation of A. (C) Wild type (WT; MNY1002), hac1Δ (MNY1010), and ireΔ (MNY1011) were released from α-factor arrest for 3 h before fixation and microscopic examination. (D) Wild type (RHY2724), hrd1Δ (RHY5088), hof1Δ (RHY5954), chs2Δ (RHY5955), cyk3Δ (RHY5956), mlc2Δ (RHY5957), doa10Δ (RHY5958), and bni1Δ (RHY5959) cells, which expressed a 4× UPRE-GFP reporter construct, were analyzed by flow cytometry to measure UPR activity in the absence of externally induced ER stress. Graphs represent fold induction compared with wild-type cells. All error bars represent the SD of three repeats.
Figure 6.
Figure 6.
Summary of results. When the ER is perturbed (ero1-1-restrictive growth or Tm treatment), budding, DNA replication, Clb2p synthesis, spindle formation, nuclear division, Cdc14p release, Clb2p degradation, spindle breakdown, and actin repolarization occur at the same time as unstressed cells. However, ero1-1-restrictive growth and Tm treatment delay cytokinesis, resulting in the formation of cells with extra buds and high DNA content. Green, tubulin; red, actin; dark blue, nucleus; light blue, Cdc14p.

References

    1. Arnold, E., and W. Tanner. 1982. An obligatory role of protein glycosylation in the life cycle of yeast cells. FEBS Lett. 148:49–53. - PubMed
    1. Biggins, S., F.F. Severin, N. Bhalla, I. Sassoon, A.A. Hyman, and A.W. Murray. 1999. The conserved protein kinase Ipl1 regulates microtubule binding to kinetochores in budding yeast. Genes Dev. 13:532–544. - PMC - PubMed
    1. Brill, J.A., G.R. Hime, M. Scharer-Schuksz, and M.T. Fuller. 2000. A phospholipid kinase regulates actin organization and intercellular bridge formation during germline cytokinesis. Development. 127:3855–3864. - PubMed
    1. Casagrande, R., P. Stern, M. Diehn, C. Shamu, M. Osario, M. Zuniga, P.O. Brown, and H. Ploegh. 2000. Degradation of proteins from the ER of S. cerevisiae requires an intact unfolded protein response pathway. Mol. Cell. 5:729–735. - PubMed
    1. Chapman, R., C. Sidrauski, and P. Walter. 1998. Intracellular signaling from the endoplasmic reticulum to the nucleus. Annu. Rev. Cell Dev. Biol. 14:459–485. - PubMed

Publication types

Substances