. 2007 Aug;27(16):5871-86.
doi: 10.1128/MCB.02087-06. Epub 2007 Jun 11.

Mice with a disruption of the imprinted Grb10 gene exhibit altered body composition, glucose homeostasis, and insulin signaling during postnatal life

Affiliations

Mice with a disruption of the imprinted Grb10 gene exhibit altered body composition, glucose homeostasis, and insulin signaling during postnatal life

Florentia M Smith et al. Mol Cell Biol. 2007 Aug.

Abstract

The Grb10 adapter protein is capable of interacting with a variety of receptor tyrosine kinases, including, notably, the insulin receptor. Biochemical and cell culture experiments have indicated that Grb10 might act as an inhibitor of insulin signaling. We have used mice with a disruption of the Grb10 gene (Grb10Delta2-4 mice) to assess whether Grb10 might influence insulin signaling and glucose homeostasis in vivo. Adult Grb10Delta2-4 mice were found to have improved whole-body glucose tolerance and insulin sensitivity, as well as increased muscle mass and reduced adiposity. Tissue-specific changes in insulin receptor tyrosine phosphorylation were consistent with a model in which Grb10, like the closely related Grb14 adapter protein, prevents specific protein tyrosine phosphatases from accessing phosphorylated tyrosines within the kinase activation loop. Furthermore, insulin-induced IRS-1 tyrosine phosphorylation was enhanced in Grb10Delta2-4 mutant animals, supporting a role for Grb10 in attenuation of signal transmission from the insulin receptor to IRS-1. We have previously shown that Grb10 strongly influences growth of the fetus and placenta. Thus, Grb10 forms a link between fetal growth and glucose-regulated metabolism in postnatal life and is a candidate for involvement in the process of fetal programming of adult metabolic health.


Figures
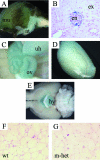
FIG. 1.
FIG. 1.
Expression of Grb10 in adults is imprinted and restricted to a limited set of tissues. Adult organs were collected following maternal (Grb10Δ2-4m/+) or paternal (Grb10Δ2-4+/p) transmission of the Grb10Δ2-4 allele and stained for β-galactosidase activity (blue staining). β-Galactosidase was expressed exclusively from the maternal allele in the skeletal muscle (mu) and adipose tissue (at) (A), endocrine pancreas (en) (B), oviduct (ov) and uterine horns (uh) (C), and Leydig cells of the testes (D). The exocrine pancreas is also shown. No expression was detected from the paternal allele in these tissues. (E) Grb10 was expressed from the paternal allele in the hypothalamus (hy), while no expression was detected from the maternal allele at this site. (F and G) WAT histology showing no major differences between wild type (wt) and Grb10Δ2-4m/+ (m-het) mouse samples.
FIG. 2.
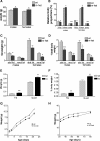
FIG. 2.
Increased body weight and reduced adiposity in adult Grb10Δ2-4m/+ (m-het) mice compared to those of the wild types (wt). (A) Total body weights of male and female mice 6 months of ages. (B) DXA analysis of total body area, percent fat tissue, and percent lean tissue. (C) Absolute weights of dissected abdominal (abd) and renal fat depots. (D) Weights of dissected abdominal (abd) and renal fat pads expressed as percentages of total body weight. (E) Absolute weights of dissected tibialis (Tib) and quadriceps (Quad) muscles. (F) Weights of dissected tibialis (Tib) and quadriceps (Quad) muscles expressed as percentages of body weight. (G and H) Mean body weights of Grb10Δ2-4m/+ and wild-type animals recorded from birth to 80 days of age. Data from the same animals has been divided into preweaning (G) and postweaning (H) data, representing the rapid-growth and slow-growth periods, respectively. All results are expressed as means ± SEM (*, P < 0.05; **, P < 0.01; ***, P < 0.001).
FIG. 3.
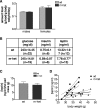
FIG. 3.
Food intake and serum glucose, insulin, and leptin levels in adult Grb10Δ2-4m/+ (m-het) and wild-type (wt) animals. (A) Food consumption (grams food per gram of body weight per day) of 6-month-old male and female mice. (B) Serum glucose, insulin, and leptin concentrations in free-fed 6-month-old males. (C) Serum leptin concentration normalized for WAT mass. (D) Correlation between serum leptin levels and total body weight for wild-type (wt; P = 0.0005) and Grb10Δ2-4m/+ (m-het; P = 0.1416 [nonsignificant]) assessed using a two-tailed Spearman's rank correlation test. All results are expressed as means ± SEM and were compared using ANOVA, except as stated for panel D (*, P < 0.05).
FIG. 4.
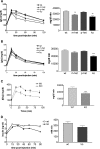
FIG. 4.
Improved glucose clearance in Grb10Δ2-4 mutant mice. Results of i.p. GTT for male (A) and female (B) mice at 10 months of age who fasted overnight are shown (left panels). Grb10Δ2-4m/+ (m-het), Grb10Δ2-4+/p (p-het) and Grb10Δ2-4m/p (ko) animals are compared with wild-type (wt) littermate controls. The incremental areas under the glucose curves are shown (right panels). (C) GTT for males 18 to 22 weeks of age. (D) Serum insulin concentration during a GTT. All results are expressed as means ± SEM (*, P < 0.05; **, P < 0.01; ***, P < 0.001 [ANOVA]).
FIG. 5.
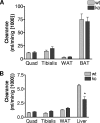
FIG. 5.
Comparison of wild-type (wt) and Grb10Δ2-4m/p (ko) male mice 18 to 22 weeks of age for clearance of 2-[3H]DOG (A) and [U-14C]glucose (B) into insulin-responsive tissues. The tissues used were quadriceps (Quad) and tibialis muscles, WAT, brown adipose tissue (BAT), and liver. All results are expressed as means ± SEM (*, P < 0.05 [ANOVA]).
FIG. 6.
FIG. 6.
Improved insulin action in Grb10Δ2-4 mutant mice. Results of i.p. ITT for male (A) and female (B) mice at 17 to 21 weeks of age who fasted overnight (left panels) are shown, with Grb10Δ2-4m/+ (M-het), and Grb10Δ2-4m/p (Ko) animals compared to wild-type (Wt) controls. The incremental areas under the glucose curves are shown (right panels). All results are expressed as means ± SEM (**, P < 0.05; ***, P < 0.001 [ANOVA]).
FIG. 7.
FIG. 7.
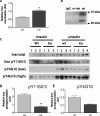
Insr levels and tyrosine phosphorylation in quadriceps muscles from wild-type (wt) and Grb10Δ2-4m/p (ko) mice. AU, arbitrary units. (A) Insr levels in the absence of insulin treatment. Tissue lysates were Western blotted with antibodies that recognize all forms of the Insr. Following densitometric analysis, total Insr levels were normalized using total extracellular signal-regulated kinase as a loading control. (B) Coimmunoprecipitation of Grb10 with the Insr. Bands of the expected size for Grb10 (located between markers at 50 kDa and 75 kDa) were detected in skeletal muscle samples from wild-type animals (wt) but not Grb10Δ2-4m/+ animals (m-het) following immunoprecipitation with an anti-Insr antibody and then Western blotting with an anti-Grb10 antibody. Similarly, no Grb10 protein was detected when the anti-Insr antibody was omitted from the immunoprecipitation reaction (immunoglobulin G control [IgG]). (C) Insr tyrosine phosphorylation. Following immunoprecipitation of the Insr, Western blots were probed with antibodies that recognize either Insr phosphorylated within the activation loop (pY1162/3) or all tyrosine-phosphorylated forms of the Insr (pY4G10). Both low and high exposures of the same blot are shown for the pY4G10 antibody. Immunoprecipitates were also Western blotted for total Insr content. (D) Insr phosphorylation within the activation loop, normalized for total Insr levels. (E) Levels of all tyrosine-phosphorylated forms of Insr, normalized for total Insr levels. All results are expressed as means ± SEM (*, P < 0.05; **, P < 0.01 [Student's t test]).
FIG. 8.
FIG. 8.
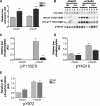
Insr levels and tyrosine phosphorylation in WAT from wild-type (wt) and Grb10Δ2-4m/p (ko) mice. AU, arbitrary units. (A) Insr levels. These were determined as described for Fig. 7A. (B) Insr tyrosine phosphorylation from control (−insulin) and insulin-stimulated (+insulin) animals was determined as described for Fig. 7C. Both low and high exposures of the same blot are shown for the pY1162/3 antibody. (C) Insr phosphorylation within the activation loop (Y1162/3), normalized for total Insr levels. (D) Levels of all tyrosine phosphorylated forms of Insr (pY4G10), normalized for total Insr levels. (E) Insr phosphorylation within the region that acts as a docking site for IRS-1 (pY972), normalized for total Insr levels. All results are expressed as means ± SEM (**, P < 0.01; ***, P < 0.001 [Student's t test]).
FIG. 9.
FIG. 9.
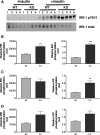
IRS-1 tyrosine phosphorylation in wild-type (wt) and Grb10Δ2-4m/p (ko) mice. (A) Tissue lysates from both control (−insulin) and insulin-stimulated (+insulin) animals were Western blotted with antibodies specific for Y612-phosphorylated IRS-1 and for total IRS-1. Blots of quadriceps muscle lysates are shown as an example. (B to D) Absolute levels of insulin-stimulated IRS-1 tyrosine phosphorylation (left panels) and relative levels of tyrosine-phosphorylated IRS-1 (that have been corrected for total IRS-1) (right panels) in quadriceps muscle (B), tibialis muscle (C), and WAT (D) are shown. All results are expressed as means ± SEM (*, P < 0.05; **, P < 0.01; ***, P < 0.001 [Student's t test]). AU, arbitrary units.
FIG. 10.
FIG. 10.
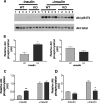
Akt activation in wild-type (wt) and Grb10Δ2-4m/p (ko) mice. AU, arbitrary units. (A) Tissue lysates from both control and insulin-stimulated animals were Western blotted with antibodies specific for Akt phosphorylated at serine 473 (Akt pS473) and for total Akt. Blots of quadriceps muscle lysates are shown as an example. Results for control (−insulin) and insulin-stimulated (+insulin) samples were scanned for densitometry following exposure to film for different lengths of time and are consequently displayed on separate histograms. (B to D) Relative levels of serine 473-phosphorylated Akt, corrected for total Akt levels in quadriceps muscle (B), tibialis muscle (C), and WAT (D) are shown. All results are expressed as means ± SEM (*, P < 0.05; **, P < 0.01 [Student's t test]).
FIG. 11.
FIG. 11.
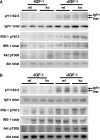
IGF1R signaling in skeletal muscles of wild-type (wt) and Grb10Δ2-4m/p (ko) mice. Tissue lysates from tibialis (A) and quadriceps (B) muscles were prepared from animals injected with IGF1 (+IGF-1) and control animals injected with vehicle alone (−IGF-1). Lysates were Western blotted directly with antibodies that recognize all forms of Igf1r (Igf1r total), Igf1r phosphorylated within the activation loop (pY1162/3; note that this antibody also detects the equivalent phosphorylated Insr isoforms), total IRS-1, tyrosine-phosphorylated IRS-1 (IRS-1 pY612), total Akt, or threonine-phosphorylated Akt (Akt T308).

Similar articles

Cited by

References

    1. Accili, D., J. Drago, E. J. Lee, M. D. Johnson, M. H. Cool, P. Salvatore, L. D. Asico, P. A. Jose, S. I. Taylor, and H. Westphal. 1996. Early neonatal death in mice homozygous for a null allele of the insulin receptor gene. Nat. Genet. 12:106-109. - PubMed
    1. Arnaud, P., D. Monk, M. Hitchins, E. Gordon, W. Dean, C. V. Beechey, J. Peters, W. Craigen, M. Preece, P. Stanier, G. E. Moore, and G. Kelsey. 2003. Conserved methylation imprints in the human and mouse GRB10 genes with divergent allelic expression suggests differential reading of the same mark. Hum. Mol. Genet. 12:1005-1019. - PubMed
    1. Asante-Appiah, E., and B. P. Kennedy. 2003. Protein tyrosine phosphatases: the quest for negative regulators of insulin action. Am. J. Physiol. Endocrinol. Metab. 284:E663-E670. - PubMed
    1. Bence, K. K., M. Delibegovic, B. Xue, C. Z. Gorgun, G. S. Hotamisligil, B. G. Neel, and B. B. Kahn. 2006. Neuronal PTP1B regulates body weight, adiposity and leptin action. Nat. Med. 12:917-924. - PubMed
    1. Bennett, W. R., T. E. Crew, J. M. W. Slack, and A. Ward. 2003. Structural-proliferative units and organ growth: effects of insulin-like growth factor 2 on growth of colon and skin. Development 130:1079-1088. - PubMed

Publication types

MeSH terms