. 2007 Aug;27(16):5790-805.
doi: 10.1128/MCB.00778-07. Epub 2007 Jun 11.

Role of phospholipase Cgamma1 in cell spreading requires association with a beta-Pix/GIT1-containing complex, leading to activation of Cdc42 and Rac1

Affiliations

Role of phospholipase Cgamma1 in cell spreading requires association with a beta-Pix/GIT1-containing complex, leading to activation of Cdc42 and Rac1

Neil P Jones et al. Mol Cell Biol. 2007 Aug.

Abstract

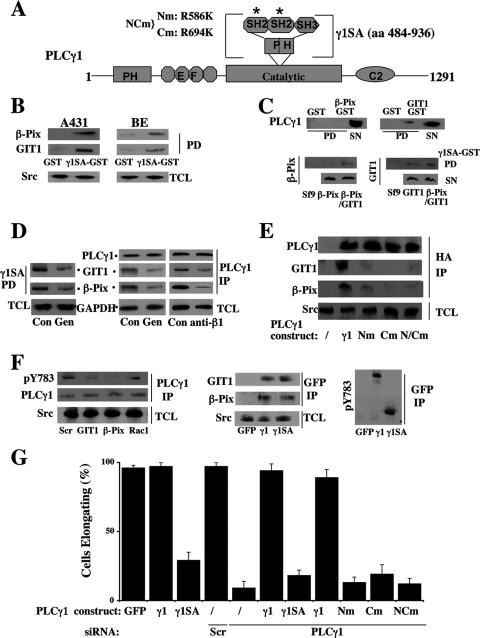
The significance of multiprotein signaling complexes in cell motility is becoming increasingly important. We have previously shown that phospholipase Cgamma1 (PLCgamma1) is critical for integrin-mediated cell spreading and motility (N. Jones et al., J. Cell Sci. 118:2695-2706, 2005). In the current study we show that, on a basement membrane-type matrix, PLCgamma1 associates with the adaptor protein GIT1 and the Rac1/Cdc42 guanine exchange factor beta-Pix; GIT1 and beta-Pix form tight complexes independently of PLCgamma1. The association of PLCgamma1 with the complex requires both GIT1 and beta-Pix and the specific array region (gammaSA) of PLCgamma1. Mutations of PLCgamma1 within the gammaSA region reveal that association with this complex is essential for the phosphorylation of PLCgamma1 and the progression to an elongated morphology after integrin engagement. Short interfering RNA (siRNA) depletion of either beta-Pix or GIT1 inhibited cell spreading in a fashion similar to that seen with siRNA against PLCgamma1. Furthermore, siRNA depletion of PLCgamma1, beta-Pix, or GIT1 inhibited Cdc42 and Rac1 activation, while constitutively active forms of Cdc42 or Rac1, but not RhoA, were able to rescue the elongation of these cells. Signaling of the PLCgamma1/GIT1/beta-Pix complex to Cdc42/Rac1 was found to involve the activation of calpains, calcium-dependent proteases. Therefore, we propose that the association of PLCgamma1 with complexes containing GIT1 and beta-Pix is essential for its role in integrin-mediated cell spreading and motility. As a component of this complex, PLCgamma1 is also involved in the activation of Cdc42 and Rac1.


Figures

FIG. 1.
FIG. 1.
PLCγ1, β-Pix, and GIT1 form interaction complexes in various cell lines. (A) Expression of PLCγ1, β-Pix, and GIT1 in BE (colorectal) and A431 (squamous carcinoma) cells and PLCγ1 and PLCγ1+ MEFs analyzed by Western blotting. (A faint nonspecific band is observed in the PLCγ1 MEF with the Sigma PLCγ1 antibody but not with the other antibodies used in this study; further-more, these cells have been well characterized as being deficient in PLCγ1 [24]). (B) PLCγ1, β-Pix, and GIT1 coimmunoprecipitate. BE or A431 cells or MEFs were plated on Matrigel for 4 h and then recovered from Matrigel and lysed, and immunoprecipitation (IP) was performed with PLCγ1, β-Pix, or GIT1 antibodies as indicated below the panels. Subsequent Western blotting of these samples was performed using PLCγ1, β-Pix, or GIT1 antibodies as indicated. (C) Complex formation between PLCγ1 and GIT1/β-Pix requires both GIT1 and β-Pix. Western blots showing the effect of the indicated siRNA depletion of PLCγ1, β-Pix, or GIT1 protein in BE cells are shown in the left panel. For IP experiments (right panel), BE cells previously treated with the indicated siRNAs (Scr, scrambled; PLCγ1, smart pool to PLCγ1; β-Pix, smart pool to β-Pix; and GIT1, smart pool to GIT1) were plated on Matrigel for 4 h and then recovered from Matrigel, lysed, and subjected to IP using anti-PLCγ1 antibody. Subsequent Western blotting of these samples was performed using PLCγ1, β-Pix, or GIT1 antibodies as indicated; Western blots for GAPDH levels in total cell lysate (TCL) were used as a loading control (bottom panels). (D) PLCγ1, β-Pix, and GIT1 siRNAs inhibit cell elongation on Matrigel. Pretreated (with the indicated siRNA, as described for panel C) BE cells were plated on Matrigel, and the level of elongation analyzed by phase-contrast microscopy (large panels). Cells were also stained with phalloidin and analyzed for individual cell spreading (insert panels). (E) Graphical representation of the effects of PLCγ1, β-Pix, and GIT1 siRNAs (as described for panel C) on BE cell elongation on Matrigel. The number of elongated cells (per 100 cells) were counted and expressed as a percentage of the total cell number (n = 4 fields analyzed). Error bars show standard deviations.
FIG. 2.
FIG. 2.
Tiam1, p130CAS, and Crk1/2 do not interact with PLCγ1 or affect the elongation of BE cells on Matrigel. (A) PLCγ1 does not complex with Tiam1, p130CAS, or Crk1/2. BE cells were extracted from Matrigel 4 h after plating, lysed, and subjected to immunoprecipitation with PLCγ1 antibody. Both the supernatants (SN) and immunoprecipitates (IP) were subjected to Western blotting using PLCγ1, GIT1, Tiam1, p130CAS, and Crk1/2 antibodies. (B) siRNA treatment against Tiam1, p130CAS, or Crk1/2 does not inhibit cell spreading. BE cells were pretreated with the indicated siRNA probes (scrambled [Scr] and against PLCγ1, Tiam1, p130CAS or Crk1/2) and plated on Matrigel for 4 h. Representative Western blots for Tiam1, p130CAS, and Crk1/2 siRNA treatments are shown in upper panels. The level of elongation was analyzed by phase-contrast microscopy (lower panels). Cells were also stained with phalloidin and analyzed for individual cell spreading (insert panels). (C) Graphical representation of the effects of PLCγ1, Tiam1, p130CAS, and Crk1/2 siRNAs (as described for panel B) on BE cell elongation on Matrigel. The number of elongated cells (per 100 cells) was determined and expressed as a percentage of the total cell number (n = 4 fields analyzed). Error bars show standard deviations.
FIG. 3.
FIG. 3.
Importance of PLCγ1SA domain in interactions with GIT1 and β-Pix. (A) Domain organization of PLCγ1, showing the SA region (aa 484 to 936) and positions of mutations in SH2 domains (*) in PLCγ1. Nm, R586K mutation in N-terminal SH2 domain; Cm, R694K mutation in C-terminal SH2; NCm, R586K and R694K mutations. (B) Cellular β-Pix and GIT1 interact with the γSA domain of PLCγ1. A431 or BE cells were lysed, and the cell extract incubated with GST-PLCγ1SA or GST alone bound to glutathione beads. The resulting pull-down complex was analyzed by Western blotting; Src present in the initial total cell lysate (TLC) was included as a loading control. (C) Purified GIT1 and β-Pix weakly interact with the γSA domain of PLCγ1. The purified γSA domain of PLCγ1 containing a histidine tag was incubated with either GST-GIT1 (upper right panel) or GST-β-Pix (upper left panel) or GST alone bound to glutathione beads (upper panels). Sf9 lysates containing GIT1, β-Pix, or GIT1/β-Pix were incubated with GST-γ1SA bound to glutathione beads (lower panels). The resulting pull-down complexes were analyzed by Western blotting using the antibodies indicated. (D) Cellular tyrosine phosphorylation is important for interactions between PLCγ1 and GIT1/β-Pix. BE cells pretreated with genistein (50 μM) were plated on Matrigel for 4 h and lysed, and the cell extract incubated with GST-γ1SA. The resulting pull-down complex was analyzed by Western blotting (left panel). BE cells pretreated (1 h) with genistein (50 μM) or β1 integrin-blocking antibody (anti-β1, 10 μg/ml), were plated on Matrigel for 4 h, lysed, and subjected to immunoprecipitation (IP) using anti-PLCγ1 antibody. Subsequent Western blotting of these samples was performed using PLCγ1, β-Pix, or GIT1 antibodies as indicated; Western blots for GAPDH levels in total cell lysate (TCL) were used as a loading control (right panel). (E) SH2 domains of PLCγ1 are important for PLCγ1 interactions with GIT1/β-Pix. BE cells transfected with HA-tagged full-length PLCγ1 (γ1) or full-length PLCγ1 with point mutations in either N-SH2 (Nm), C-SH2 (Cm) or N- and C-SH2 (NCm) were extracted from Matrigel 4 h after plating, lysed, and subjected to IP with HA antibody. Subsequent Western blotting of these samples was performed using antibodies to PLCγ1, β-Pix, or GIT1 or, as a loading control in TCL, using antibodies to Src. (F) The interaction of GIT1 and β-Pix with PLCγ1SA facilitates the phosphorylation of PLCγ1SA on the activating tyrosine 783 site. BE cells treated with siRNAs (scrambled [Scr], GIT1, β-Pix, or Rac1 [for effectiveness of GIT1 and β-Pix siRNAs, see Fig. 1C, and for Rac1 siRNA, see Fig. 6A]) were extracted from Matrigel 4 h after plating, lysed, and subjected to IP with PLCγ1 antibody. Subsequent Western blotting of these samples was performed using either phospho-PLCγ1 (pY783) or PLCγ1 antibodies as indicated; Western blots for Src levels were used as a loading control (left panels). BE cells, transfected with GFP alone (GFP), GFP-tagged full-length PLCγ1 (γ1), or GFP-tagged PLCγ1SA (γ1SA), were extracted from Matrigel 4 h after plating, lysed, and subjected to IP with GFP antibody, and the Western blots analyzed using GIT1, β-Pix (middle panels), or pY783 (right panel) antibodies. (G) Graphical representation of the effects of PLCγ1 constructs on BE cell elongation and the ability of PLCγ1 constructs to rescue cells treated with PLCγ1 siRNA. The numbers of elongating BE cells on Matrigel after transfection with GFP (GFP) and GFP-tagged PLCγ1 constructs (γ1 and γ1SA) were analyzed in untreated cells (bars 1 to 3). The numbers of elongating BE cells on Matrigel after siRNA treatments and subsequent transfection with the indicated PLCγ1 constructs are shown in bar 4 (Scr, scrambled siRNA) and bars 5 to 11 (PLCγ1 siRNA). The number of elongated cells was determined as described in Materials and Methods and expressed as a percentage of the total cell number selected for the analysis. Error bars show standard deviations.
FIG. 4.
FIG. 4.
Importance of GIT1 and β-Pix in forming complexes with PLCγ1. (A) Interaction between PLCγ1 and β-Pix in BE cells. Domain organization of β-Pix: the wild type (WT) and various deletion variants (ΔSH3, ΔPH, and ΔDH) of β-Pix are shown (upper panel). The expression of the indicated GFP-tagged β-Pix deletion variants was analyzed by Western blotting using anti-GFP antibody (middle panel). Results of immunoprecipitation of BE cells transfected with β-Pix constructs and subsequent Western blotting are shown in lower panels; immunoprecipitation (IP) was either with GFP antibody (lower left panel) or PLCγ1 antibody (lower right panel). Src (present in total cell lysates [TCL]) was included as a loading control in both cases. (B) Graphical representation of the ability of GFP-tagged GIT1 or β-Pix variants to rescue the elongation on Matrigel of BE cells treated with either GIT1 or β-Pix siRNA. The following GFP-tagged GIT1 variants were used in cells treated with GIT1 siRNA (bars 2 to 5): GFP alone (GFP), wild-type GIT1 (GIT), GIT1 GAP region (aa 1 to 374) (GAP), and GIT1 SP region (aa 486 to 645) (SP). β-Pix siRNA-treated cells (bars 6 to 10) were transfected with GFP only or the following GFP-tagged variants of β-Pix: wild-type β-Pix (Pix), the SH3 domain deletion variant (ΔSH3), the PH domain deletion variant (ΔPH), and the DH domain deletion variant (ΔDH). The number of elongated cells was determined as described in Materials and Methods and expressed as a percentage of the total cell number selected for the analysis. Error bars show standard deviations. Scr, scrambled siRNA.
FIG. 5.
FIG. 5.
PLCγ1, GIT1, and β-Pix are all required for cell spreading on Matrigel. (A) PLCγ1, β-Pix, and GIT1 siRNAs inhibit the elongation of BE cells on Matrigel, and rescue of cell spreading is specific to restoration of expression of the siRNA's targeted protein. BE cells pretreated with siRNA were transfected with specific PLCγ1, GIT1, or β-Pix plasmids (GFP-tagged variants that are not targeted by PLCγ1, GIT1, or β-Pix siRNA, respectively) or scrambled siRNA (Scr). Cells were stained with phalloidin, and individual cell spreading analyzed. (B) Cdc42 and Rac1, but not RhoA, GTPases can rescue PLCγ1, GIT1, or β-Pix knockout effects on cell spreading. BE cells were transfected with constitutively active Rho family GTPases (Rac1 V12, Cdc42 L61, or RhoA V14) after prior treatment with PLCγ1, GIT1, or β-Pix siRNA and plated on Matrigel. Cells were stained with phalloidin, and individual cells analyzed by fluorescence microscopy. (C) Graphical representation of the effects of PLCγ1, GIT1, and β-Pix rescue constructs (upper panel) and constitutively active (CA) Rac1, Cdc42, and RhoA constructs (lower panel) on the elongation on Matrigel of BE cells pretreated with either PLCγ1, β-Pix, or GIT1 siRNA. For the experiments shown in the upper panel, conditions were as described for panel A. BE cells were treated with scrambled siRNA (bar 1), PLCγ1 siRNA (bars 2 to 5), GIT1 siRNA (bars 6 to 9), or β-Pix siRNA (bars 10 to 13). The transfection was with GFP-tagged constructs of PLCγ1, GIT1, or β-Pix as indicated. Lower panel shows quantitative analysis of data using conditions as described for panel B. BE cells were treated with siRNA as described for upper panel and then transfected with constitutively active Cdc42L61 (Cdc), Rac1V12 (Rac), or RhoAV14 (Rho) construct as indicated. In both cases, the number of elongated cells was determined and expressed as a percentage of the total cell number selected for the analysis. Error bars show standard deviations.
FIG. 6.
FIG. 6.
Cdc42 and Rac1, but not RhoA, are essential for cell spreading on Matrigel. (A) Cdc42 or Rac1 siRNA treatment of BE cells prevents cell elongation. BE cells pretreated with the indicated siRNA were plated on Matrigel, and cell morphology analyzed by phase-contrast microscopy (upper panel). Cells were also labeled with phalloidin, and individual cells analyzed by fluorescence microscopy (lower panel). Western blot of BE cells from Matrigel (right panels) shows the effectiveness of the Cdc42, Rac1, and RhoA siRNA (smart pool) probes. (B) Dominant negative (DN) variants or inhibitors of Cdc42 or Rac1, but not RhoA, inhibit cell spreading. BE cells were treated with inhibitors of Rac (10 μM NCS23766) or a Rho target, ROCK (10 μM Y27632), or transfected with dominant negative GTPase constructs (Rac1 N17, Cdc42 N17, or RhoA N19) and then plated on Matrigel. Cells were stained with phalloidin, and individual cells analyzed by fluorescence microscopy. (C) Cdc42 or Rac1 can signal downstream of PLCγ1 in MEFs. PLCγ+ MEFs were transfected with the indicated dominant negative variants of these GTPases (upper panel). PLCγ MEFs were transfected with plasmids encoding constitutively active forms of Rac1, Cdc42, or RhoA prior to plating on Matrigel (lower panel). In both cases, the cells were plated on Matrigel, stained with phalloidin, and analyzed by fluorescence microscopy. (D) Graphical representation of the effects of Rac1, Cdc42, and RhoA siRNAs, Rho family constructs, and pharmacological inhibitors on cell elongation on Matrigel. BE cells treated with the indicated siRNA, dominant negative construct, or inhibitor using conditions as described for panels plated on Matrigel, and the number of elongating cells determined 4 h after plating (upper panel). For siRNA treatment (bars 1 to 4), the following probes were used: scrambled siRNA (Scr), Cdc42 siRNA (Cdc), Rac1 siRNA (Rac), or RhoA siRNA (Rho). BE cells were also transfected with dominant negative construct (bars 6 to 9) Cdc42 N17 (Cdc), Rac1 N17 (Rac), or RhoAN19 (Rho) or treated with pharmacological inhibitor (bars 9 and 10) using 10 μM Rac inhibitor NCS23766 (*) and 10 μM Rock inhibitor Y27632 (**). Conditions for quantitative analysis of MEF elongation (lower panel) were as described for panel C. Cells transfected with the indicated dominant negative (PLCγ+ MEFs, bars 2 to 4) or constitutively active (CA) (PLCγ MEFs, bars 5 to 8) constructs were plated on Matrigel and the number of elongating cells determined 4 h after plating. Dominant negative constructs, bars 2 to 4: Cdc42 N17 (Cdc), Rac1 N17 (Rac), and RhoA N19 (Rho). Constitutively active constructs, bars 6 to 8: Cdc42 L61 (Cdc), Rac1 V12 (Rac), and RhoA V14 (Rho).
FIG. 7.
FIG. 7.
Requirements for activation of Cdc42 and Rac1. (A) Time course for Cdc42 activation on Matrigel. Serum-starved (24 h) BE cells were plated on Matrigel for the times shown (pre: preplating). Cell extracts were then analyzed in the N-WASP RBD pull down (PD) to isolate active Cdc42 and processed as described for panel B. Results from several experiments were analyzed, and the results expressed graphically as relative Cdc42 activity. A representative Western blot is also shown. TCL, total cell lysates. (B) BE cells, control and treated with U73122 (2 μM) (U731), or MEFs (PLCγ+ and PLCγ) were plated on Matrigel for 4 h. The cell extracts were subsequently analyzed by PAK RBD pull-down assay to isolate active Rac1 (left panel) or subjected to N-WASP RBD pull down to isolate active Cdc42 (right panel). Western blots using anti-Rac1 and anti-Cdc42 antibodies were performed on the pull-down precipitates and on total cell lysates to assess both the amount of GTP-bound Rac1 or Cdc42 (in pull downs) and total Rac1 or Cdc42 (in total cell lysates). The samples of total cell lysates were also subjected to Western blotting using anti-Src antibody to assess total protein levels (loading control). All blots were quantified by densitometry, and the Cdc42 or Rac1 activity calculated based on the ratios of active Rac1 or Cdc42 to total Rac1 or Cdc42 when corrected for protein loading. Results from several experiments were analyzed and were expressed graphically as a percentage of the Cdc42 or Rac1 activity in control, untreated BE cells (n = 4 experiments). Representative Western blots are also shown. (C) Control BE cells (Con) and BE cells transfected with the indicated constructs encoding dominant negative Rho family GTPases (Rac1 N17, Cdc42 N17, and RhoA N19) were plated on Matrigel for 4 h, and GTPase activity assessed by pull-down assays. Rac1 activity (left panel) and Cdc42 activity (right panel) were analyzed and are presented as described for panel B. Error bars show standard deviations.
FIG. 8.
FIG. 8.
PLCγ1/GIT1/β-Pix signal to activate Cdc42 and Rac1. (A) siRNA knockdown of PLCγ1, GIT1, β-Pix, Cdc42, Rac1, and RhoA in BE cells was performed as described in the Fig. 1 and 6 legends. Cells treated with siRNA were plated on Matrigel for 4 h, and subsequently, the cell extracts subjected to PAK RBD pull-down assay to isolate active Rac; the resulting precipitates and the total cell extracts were analyzed by Western blotting using antibodies to Rac1 and Src, for a loading control. After quantification of selected areas on Western blots, the data were normalized for loading and the Rac activity expressed as the percentage of Rac activity in control, untreated BE cells (n = 4 independent experiments). Representative Western blots are also shown. (B) BE cells were processed as described for panel A, except that N-WASP RBD was used to isolate active Cdc42 that was visualized using anti-Cdc42 antibody. A graphical representation of normal Cdc42 activities relative to the activity of the control (expressed as percentages) is shown, as well as representative Western blots. PD, pull down; TCL, total cell lysates; Scr, scrambled siRNA. Error bars show standard deviations.
FIG. 9.
FIG. 9.
PLCγ1 signaling pathways utilize calpain activity as one route by which they signal to Cdc42/Rac1. (A) Calpain activity and calcium facilitate Cdc42 activation. Cells were plated on Matrigel and either left untreated (Con) or incubated for 4 h in the presence of 2 μM PLC inhibitor U73122 (U73122), 10 μM calcium chelator BAPTA-AM (BAPTA), or 75 μg/ml calpain inhibitor calpeptin (Calp). BE cells were either analyzed for active Cdc42 (upper panel) or fixed, stained with phalloidin, and visualized by fluorescence microscopy (lower panel). (B) On Matrigel, the PLCγ1/GIT1/β-Pix complex signals to calpains. BE cells pretreated with calpeptin (75 μg/ml) (upper panel), siRNA (middle panel), or inhibitor (anti-β1 integrin antibody [anti-β1; 10 μg/ml], Src inhibitor [PP2; 10 μM], U73122 [2 μM], BAPTA [10 μM], Rac inhibitor [NCS23766 10 μM], or ROCK inhibitor [Y27632; 10 μM]) (lower panel) were incubated with the calpain substrate Boc-LM-CMAC (50 μM) prior to plating on Matrigel for 4 h. Cells were fixed and visualized by fluorescence microscopy for the presence of the fluorescent cleavage product that signifies calpain activity. For control and calpeptin treatments in top panels, representative fluorescent images (top left) are shown along with bright field images (top right) to show typical fields of view. Scram, scrambled siRNA. (C) Graphical representation of quantification of fluorescence in images from calpain activity assay. From the images from several independent experiments, individual cells were selected and fluorescence intensity quantified (Image-J). Calpain activity is expressed as a percentage of activity in the control (Con) (n = 60 cells analyzed). BE cells pretreated with calpain inhibitor, Calpeptin, or siRNA (upper panel); BE cells pretreated with PLCγ1 pathway inhibitor (lower panel). Scr, scrambled siRNA. (D) Western blot analysis of possible calpain substrates. BE cells pretreated with calpeptin (75 μg/ml), siRNA (scrambled [Scr] or PLCγ1), or U73122 (2 μM) were plated on Matrigel for 4 h, and the cells then extracted, processed for Western blotting, and probed with the antibodies to spectrin (fodrin) (full length, 240 kDa; cleavage product, 150 kDa) (upper left panel), filamin (full length, 280 kDa; cleavage product, 90 kDa) (upper right panel), and RhoA (full length, 23 kDa; cleavage product, 20 kDa) (lower right panel). Error bars show standard deviations. Con, control.
FIG. 10.
FIG. 10.
Model of PLCγ1/GIT/β-Pix signaling from integrins. Engagement of components of extracellular matrix to β1 integrins leads to phosphorylation of PLCγ1 and association of PLCγ1 with large complexes containing Pix/GIT scaffold. Subsequent activation of Rac1 and Cdc42 could be mediated by several signaling events, including stimulation of GEF activity of Pix and activation of calpains by PLC-mediated increase in cellular calcium. PIP2, phosphatidylinositol 4,5 -biphosphate; DAG, diacylglycerol; IP3, inositol 1,3,5-triphosphate.

Similar articles

Cited by

References

    1. Bae, J. Y., S. J. Ahn, J. E. Lee, J. E. Kim, M. R. Han, W. Han, S. W. Kim, H. J. Shin, S. J. Lee, D. Park, and D. Y. Noh. 2005. BetaPix-a enhances the activity of phospholipase Cgamma1 by binding SH3 domain in breast cancer. J. Cell. Biochem. 94:1010-1016. - PubMed
    1. Baird, D., Q. Feng, and R. A. Cerione. 2005. The Cool-2/alpha-Pix protein mediates a Cdc42-Rac signaling cascade. Curr. Biol. 15:1-10. - PubMed
    1. Bialkowska, K., S. Kulkarni, X. Du, D. E. Goll, T. C. Saido, and J. E. Fox. 2000. Evidence that beta3 integrin-induced Rac activation involves the calpain-dependent formation of integrin clusters that are distinct from the focal complexes and focal adhesions that form as Rac and RhoA become active. J. Cell Biol. 151:685-696. - PMC - PubMed
    1. Braiman, A., M. Barda-Saad, C. L. Sommers, and L. E. Samelson. 2006. Recruitment and activation of PLCgamma1 in T cells: a new insight into old domains. EMBO J. 25:774-784. - PMC - PubMed
    1. Carragher, N. O., S. M. Walker, L. A. Scott Carragher, F. Harris, T. K. Sawyer, V. G. Brunton, B. W. Ozanne, and M. C. Frame. 2006. Calpain 2 and Src dependence distinguishes mesenchymal and amoeboid modes of tumour cell invasion: a link to integrin function. Oncogene 25:5726-5740. - PubMed

Publication types

MeSH terms

Substances