

Single molecule detection of intermediates during botulinum neurotoxin translocation across membranes
- PMID: 17563359
- PMCID: PMC1965533
- DOI: 10.1073/pnas.0700046104
Single molecule detection of intermediates during botulinum neurotoxin translocation across membranes
Abstract
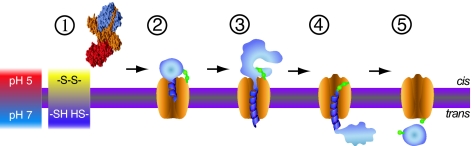
The dynamics of Clostridium botulinum neurotoxins (BoNTs) protein-translocation across membranes was investigated by using a single molecule assay with millisecond resolution on excised patches of neuronal cells. Translocation of BoNT/A light chain (LC) by heavy chain (HC) was observed in real time as an increase of channel conductance: the HC channel is occluded by the LC during transit, then unoccluded after completion of translocation and release of LC-cargo. We identified an entirely unknown succession of intermediate conductance stages during LC translocation. For the single-chain BoNT/E, by contrast to the di-chain BoNT/A, we demonstrate that productive translocation requires proteolysis of the LC cargo from the HC chaperone. We propose a model for the set of protein-protein interactions between translocase and cargo at each step of translocation that supports the notion of an interdependent, tight interplay between the HC chaperone and the LC cargo preventing LC aggregation and dictating the outcome of translocation: productive passage of cargo or abortive channel occlusion by cargo.
Conflict of interest statement
The authors declare no conflict of interest.
Figures
Similar articles
-
Molecular dissection of botulinum neurotoxin reveals interdomain chaperone function.Toxicon. 2013 Dec 1;75:101-7. doi: 10.1016/j.toxicon.2013.01.007. Epub 2013 Feb 5. Toxicon. 2013. PMID: 23396042 Free PMC article. Review.
-
Crucial role of the disulfide bridge between botulinum neurotoxin light and heavy chains in protease translocation across membranes.J Biol Chem. 2007 Oct 5;282(40):29604-11. doi: 10.1074/jbc.M703619200. Epub 2007 Jul 31. J Biol Chem. 2007. PMID: 17666397
-
Translocation of botulinum neurotoxin light chain protease by the heavy chain protein-conducting channel.Toxicon. 2009 Oct;54(5):565-9. doi: 10.1016/j.toxicon.2008.11.018. Epub 2008 Dec 14. Toxicon. 2009. PMID: 19111565 Free PMC article. Review.
-
Translocation of botulinum neurotoxin light chain protease through the heavy chain channel.Nat Struct Biol. 2003 Jan;10(1):13-8. doi: 10.1038/nsb879. Nat Struct Biol. 2003. PMID: 12459720
-
Synchronized chaperone function of botulinum neurotoxin domains mediates light chain translocation into neurons.Curr Top Microbiol Immunol. 2013;364:115-37. doi: 10.1007/978-3-642-33570-9_6. Curr Top Microbiol Immunol. 2013. PMID: 23239351
Cited by
-
Molecular dissection of botulinum neurotoxin reveals interdomain chaperone function.Toxicon. 2013 Dec 1;75:101-7. doi: 10.1016/j.toxicon.2013.01.007. Epub 2013 Feb 5. Toxicon. 2013. PMID: 23396042 Free PMC article. Review.
-
Novel platform for engineering stable and effective vaccines against botulinum neurotoxins A, B and E.Front Immunol. 2024 Sep 9;15:1469919. doi: 10.3389/fimmu.2024.1469919. eCollection 2024. Front Immunol. 2024. PMID: 39315101 Free PMC article.
-
Botulinum Toxin as a Pain Killer: Players and Actions in Antinociception.Toxins (Basel). 2015 Jun 30;7(7):2435-53. doi: 10.3390/toxins7072435. Toxins (Basel). 2015. PMID: 26134255 Free PMC article. Review.
-
A coincidence detector triggers botulinum neurotoxin translocation.Future Microbiol. 2012 Feb;7(2):185-8. doi: 10.2217/fmb.11.157. Future Microbiol. 2012. PMID: 22324987 Free PMC article.
-
Neutralization of botulinum neurotoxin by a human monoclonal antibody specific for the catalytic light chain.PLoS One. 2008 Aug 20;3(8):e3023. doi: 10.1371/journal.pone.0003023. PLoS One. 2008. PMID: 18714390 Free PMC article.
References
-
- Shapiro RL, Hatheway C, Swerdlow DL. Ann Intern Med. 1998;129:221–228. - PubMed
-
- Arnon SS, Schechter R, Inglesby TV, Henderson DA, Bartlett JG, Ascher MS, Eitzen E, Fine AD, Hauer J, Layton M, et al. J Am Med Assoc. 2001;285:1059–1070. - PubMed
-
- Weber T, Zemelman BV, McNew JA, Westermann B, Gmachl M, Parlati F, Söllner TH, Rothman JE. Cell. 1998;92:759–772. - PubMed
-
- Sutton RB, Fasshauer D, Jahn R, Brunger AT. Nature. 1998;395:347–353. - PubMed
-
- Jahn R, Lang T, Sudhof TC. Cell. 2003;112:519–533. - PubMed
Publication types
MeSH terms
Substances
Grants and funding
LinkOut - more resources
Full Text Sources
Other Literature Sources
Medical
