. 2007 Jul;37(7):1874-86.
doi: 10.1002/eji.200636751.

Expansion and activation of CD4(+)CD25(+) regulatory T cells in Heligmosomoides polygyrus infection

Affiliations

Expansion and activation of CD4(+)CD25(+) regulatory T cells in Heligmosomoides polygyrus infection

Constance A M Finney et al. Eur J Immunol. 2007 Jul.

Abstract

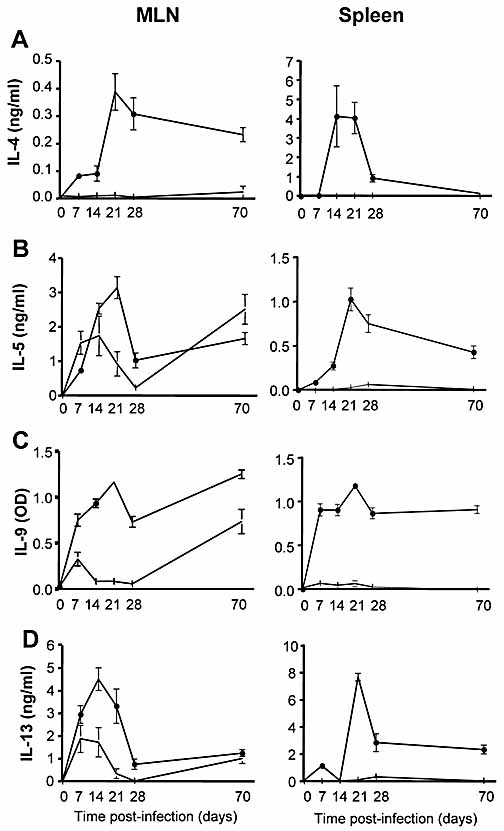
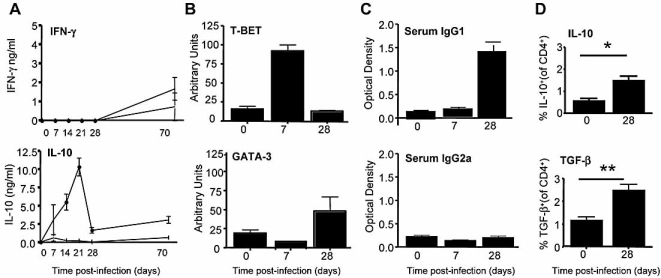
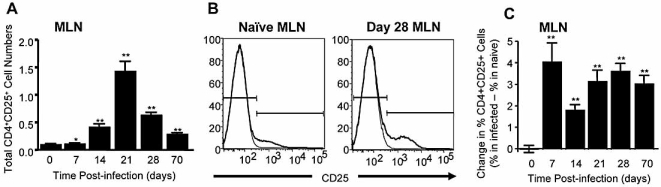
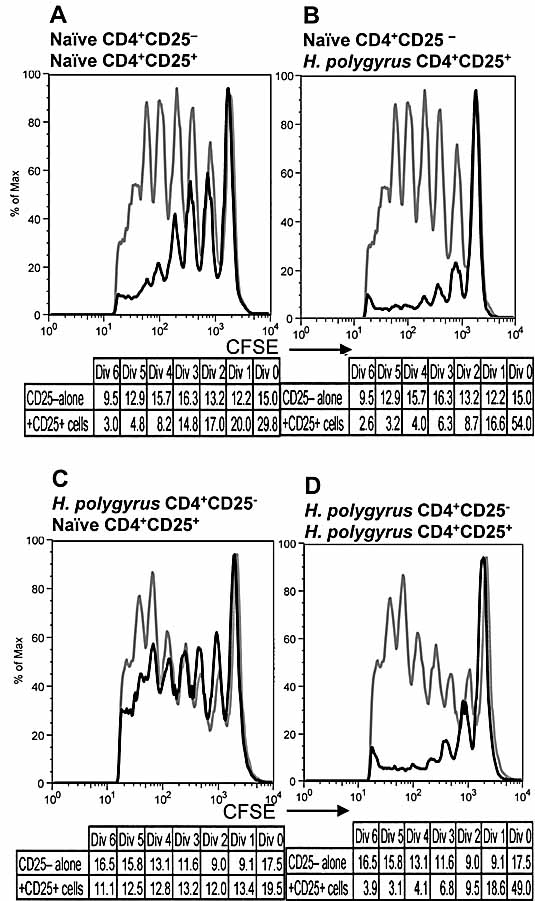
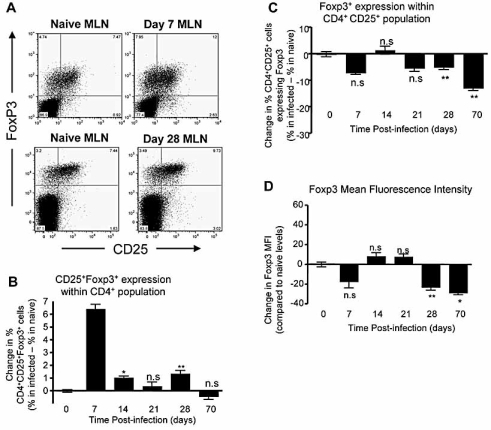
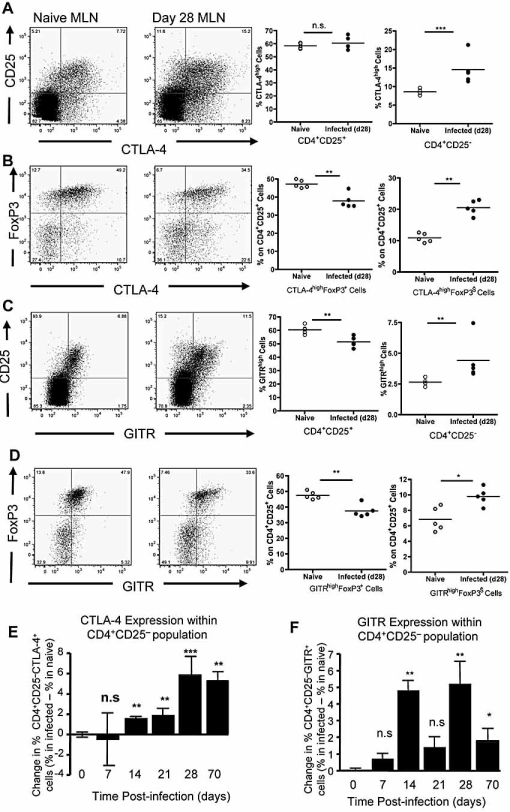
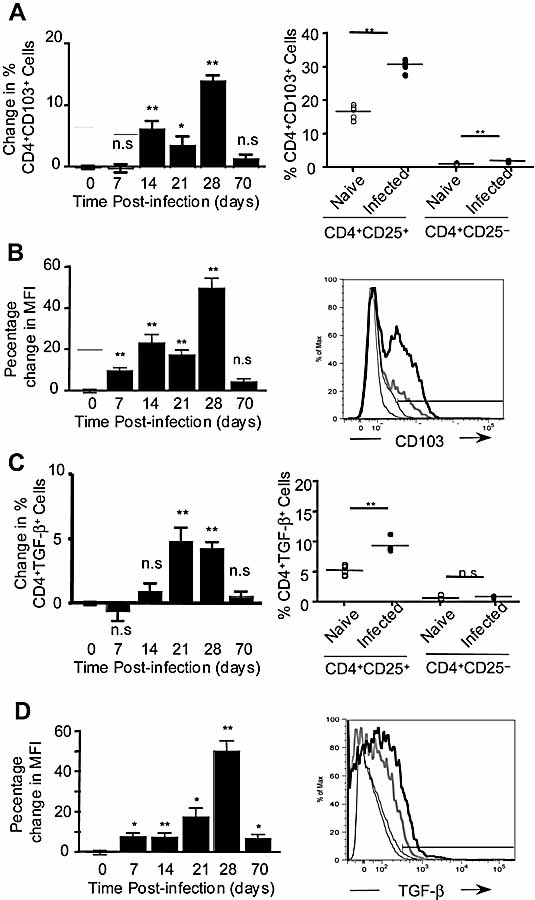
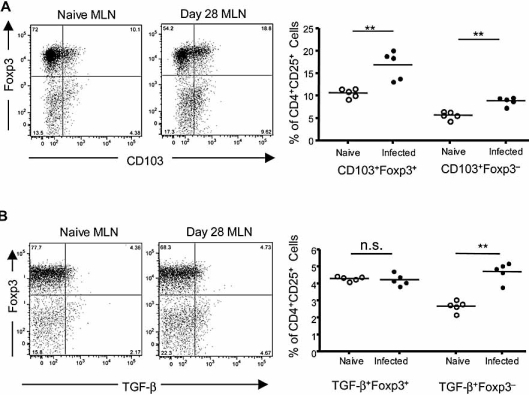
Regulatory T cell responses to infectious organisms influence not only immunity and immunopathology, but also responses to bystander antigens. Mice infected with the gastrointestinal nematode parasite Heligmosomoides polygyrus show an early Th2-dominated immune response (days 7-14), but by day 28 a strongly regulatory profile is evident with antigen-specific IL-10 release and elevated frequency of CD4(+) T cells bearing surface TGF-beta. CD4(+)CD25(+) T cells from infected mice show enhanced capacity to block in vitro effector T cell proliferation. CD4(+)CD25(+) cell numbers expand dramatically during infection, with parallel growth of both CD25(+)Foxp3(+) and CD25(+)Foxp3(-) subsets. CTLA-4 and glucocorticoid-induced tolerance-associated receptor, also associated with regulatory T cell function, become more prominent, due to both expanded CD25(+) cell numbers and increased expression among the CD25(-) population. Both intensity and frequency of CD103 expression by CD4(+) T cells rise significantly, with greatest expansion among CD25(+)Foxp3(+) cells. While TGF-beta expression is observed among both CD25(+)Foxp3(+) and CD25(+)Foxp3(-) subsets, it is the latter population which shows higher TGF-beta staining following infection. These data demonstrate in a chronic helminth infection that Foxp3(+) regulatory T cells are stimulated, increasing CD103 expression in particular, but that significant changes occur to other populations including expansion of CD25(+)TGF-beta(+)Foxp3(-) cells, and induction of CTLA-4 on CD25(-) non-regulatory lymphocytes.


Figures

Figure 1
Figure 1
Elevated Th2 cytokine responsiveness in H. polygyrus infection. Parasite antigen-specific cytokine responses are presented from MLNC (left) and spleen cells (right) taken at day 7–70 post-infection. Cells were cultured for 48 h in medium alone (open symbols) or H. polygyrus antigen (solid symbols). Panels (A–D) present respectively IL-4, IL-5, IL-9 and IL-13. Data represent means ± SE from groups of five mice assayed individually; day 0 represents all naïve mice (five for each time point).
Figure 2
Figure 2
Nascent Th1 and sustained regulatory cytokine responses in H. polygyrus infection. (A) IFN-γ and IL-10 release from MLNC directly stimulated ex vivo, taken at days 7–70 post-infection and cultured for 48 h in medium alone (open symbols) or H. polygyrus antigen (solid symbols). (B) T-BET and GATA-3 real-time PCR in MLN from naïve and infected mice. CD4+ T cells were purified from MLN, RNA was extracted and real-time PCR performed on the resulting cDNA. (C) H. polygyrus-specific serum antibodies of IgG1 and IgG2a isotypes measured by ELISA. (D) Intracellular IL-10 (left) and surface TGF-β (right) staining in naïve and day 28-infected MLN CD4+ T cells determined by flow cytometry. Data represent means ± SE from groups of five mice assayed individually; day 0 represents all naïve mice (five for each time point). *p < 0.05, **p < 0.01.
Figure 3
Figure 3
Expansion of CD25-expressing cells within the total CD4+ T cell population during H. polygyrus infection. (A) Total numbers of CD4+CD25+ T cells from day 7–70 post-infection in MLN. (B) Representative histograms of CD25 expression within MLN (left) or splenic (right) CD4+ cells from day 28-infected (black) or naïve (grey) mice; isotype controls are shown as thick black lines. (C) Changes in proportion of CD25-expressing CD4+ T cells relative to total CD4+ cells over 70 days of infection. For each point in time, the percentages of CD4+ T cells which also expressed CD25 among MLNC from infected and naïve animals were determined; the arithmetic difference between infected and naïve in percentage frequency at each time point was then calculated. The mean naïve level was 14.36% (SD = 0.80). For (A, C), Mann–Whitney tests were performed (n.s., no significant difference; *p<0.05, **p<0.01). Data represent means ± SE from groups of five mice assayed individually, compared with naïve mice at the same assay time. Day 0 represents all naïve mice (five for each time point).
Figure 4
Figure 4
CD4+CD25+ T cells from H. polygyrus-infected mice show more potent suppression of CD25 effector cell proliferation. Proliferation of 5×10⁴ CD4+CD25 T cells in response to in vitro Con A stimulation was measured by CFSE (grey lines), in populations from naïve (A, B) and day 28-infected (C, D) MLNC. In parallel cultures, equal numbers of CD4+CD25+ MLNC were added to the CD4+CD25 CFSE-loaded T cells. MLNC from infected mice (B, D; black lines) show more profound suppression than equal numbers of cells from uninfected controls (A, C; black lines). Tables beneath each graph give percentage of CD25 cells in each round of division when stimulated in the absence (upper row) or presence (lower row) of CD25+ cells. Data represent pooled cells from groups of five mice.
Figure 5
Figure 5
CD4+ T cell Foxp3 expression levels remain relatively constant during H. polygyrus infection. (A) Bivariate flow cytometry analysis of CD25 and Foxp3 expression in CD4+ T cells in naïve (far left), day 7-infected (left) and naïve (right) and day 28-infected (far right) MLNC. (B) Time course of expression of CD25+Foxp3+ as percentage of total CD4+ cells in MLN from 7–70 days of infection. The mean naïve level was 6.43% (SD = 2.27). (C) Foxp3+ T cells as proportion of total CD4+CD25+ T cells in naïve and day 28-infected MLN. The mean naïve level was 67.2% (SD = 17.1). (D) Foxp3 expression intensity over the course of infection. The percentage difference in MFI relative to uninfected values for Foxp3 was calculated. For (B–D) data represent means ± SE from groups of five mice assayed individually; day 0 represents all naïve mice (five for each time point). Mann–Whitney tests were performed (n.s., no significant difference; *p<0.05, **p<0.01).
Figure 6
Figure 6
CTLA-4 and GITR expression levels increase on CD4+CD25 cells, but not on CD4+CD25+ cells, during H. polygyrus infection. (A) CTLA-4 expression measured by flow cytometry on MLNC. (Left panels) CTLA-4 and CD25 bivariate plot from naïve and day 28-infected mice; (right panels) percentage of CTLA-4high T cells in the CD4+CD25+ and CD4+CD25 subsets. (B) CTLA-4 expression measured by flow cytometry on MLNC. (Left panels) CTLA-4 and Foxp3 bivariate plot from naïve and day 28-infected mice; (right panels) percentage of CTLA-4high T cells in the CD25+Foxp3+ and CD25+Foxp3 subsets. (C) GITR expression, measured as for CTLA-4 in Fig. 7A. (D) GITR expression, measured as for CTLA-4 in Fig. 7B. (E) Frequency of CTLA-4 expression in CD4+CD25 cells over the course of infection. Mean naïve level = 6.58% (SD = 1.82). (F) Frequency of GITR expression in CD4+CD25 cells over the course of infection. Mean naïve level = 5.45% (SD = 4.75). Data represent means ± SE from groups of five mice assayed individually. Mann–Whitney tests were performed (n.s., no significant difference; *p<0.05, **p<0.01, ***p<0.001.
Figure 7
Figure 7
CD103 and TGF-β expression is raised in frequency and intensity by H. polygyrus infection. MLNC were stained for CD4, CD25, CD103 and TGF-β and analysed by flow cytometry. For CD103 and TGF-β, the percentages within total CD4+CD25+ T cell populations were calculated, as well as the percentage change in MFI for each infected group compared to the corresponding naïve group; Mann–Whitney tests were performed (n.s., no significant difference; *p<0.05, **p<0.01). Data represent means ± SE from groups of five mice assayed individually. Day 0 represents all naïve mice (five for each time point). (A) CD103+ T cell numbers over the time course (left), and as proportion of total CD4+CD25+ or CD4+CD25 T cells in naïve and day 28-infected MLNC (right). Over the time course, mean naïve level = 18.3% (SD = 4.09). (B) CD103 expression levels over the time course (left) and in representative MLNC from naïve (grey line) and day 28-infected (thick black line) mice (right); isotype controls are shown as thin black lines. (C) TGF-β+ cell numbers over the time course (left), and as proportion of total CD4+CD25+ or CD4+CD25 T cells in naïve and day 28-infected MLNC (right). Over the time course, mean naïve level = 8.01% (SD = 2.67). (D) TGF-β expression levels over the time course (left), and in representative MLNC from naïve (grey line) and day 28-infected (thick black line) mice (right); isotype controls are shown as thin black lines.
Figure 8
Figure 8
By day 28 of infection, CD103+Foxp3+ cells increase whilst TGFβ+Foxp3+ do not. Cells were stained for CD4, CD25, CD103, Foxp3 and TGF-β. Levels of CD103, TGF-β and Foxp3 expression were determined within the CD4+CD25+ population. Mann–Whitney tests were performed (n.s., no significant difference; **p<0.01). (A) CD103 expression plotted by bivariate analysis against Foxp3 staining, in naïve and day 28-infected MLNC (left), and percentage expression of CD103+Foxp3+ and CD103+Foxp3 cells within CD25+ T cell populations (right). (B) Surface TGF-β expression plotted by bivariate analysis against Foxp3 staining, in naïve and day 28-infected MLNC (left), and percentage expression of TGF-β+Foxp3+ and TGF-β+Foxp3 cells within CD25+ T cell populations (right).

References

    1. Maizels RM, Yazdanbakhsh M. Regulation of the immune response by helminth parasites: Cellular and molecular mechanisms. Nat. Rev. Immunol. 2003;3:733–743. - PubMed
    1. Mountford AP, Trottein F. Schistosomes in the skA balance between immune priming and regulation. Trends Parasitol. 2004;20:221–226. - PubMed
    1. Harnett W, Goodridge HS, Harnett MM. Subversion of immune cell signal transduction pathways by the secreted filarial nematode product, ES-62. Parasitology. 2005;130(Suppl):S63–S68. - PubMed
    1. Smith P, Fallon RE, Mangan NE, Walsh CM, Saraiva M, Sayers JR, McKenzie ANJ, et al. Schistosoma mansoni secretes a chemokine binding protein with antiinflammatory activity. J. Exp. Med. 2005;202:1319–1325. - PMC - PubMed
    1. Maizels RM, Balic A, Gomez-Escobar N, Nair M, Taylor M, Allen JE. Helminth parasites: Masters of regulation. Immunol. Rev. 2004;201:89–116. - PubMed

Publication types

MeSH terms