

doi: 10.1371/journal.pbio.0050154.
Still stratus not altocumulus: further evidence against the date/party hub distinction
- PMID: 17564494
- PMCID: PMC1892831
- DOI: 10.1371/journal.pbio.0050154
Item in Clipboard
Still stratus not altocumulus: further evidence against the date/party hub distinction
PLoS Biol.
2007 Jun.
Abstract
Analysis of multi-validated protein interaction data reveals networks with greater interconnectivity than the more segregated structures seen in previously available data. To help visualize this, the authors draw comparisons between continuous stratus clouds and altocumulus clouds.
Figures
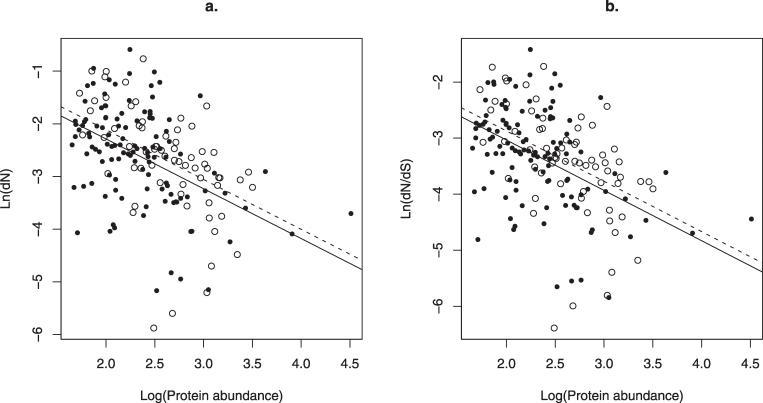
ANCOVA of natural log of rate of evolution, measured either as (A) dN or (B) dN/dS predicted by date/party distinction, with protein abundance as the covariate. The black line is for date, the dotted for party hubs. For (A), ANCOVA ln(Ka) versus party/date with log10(abundance) as a covariate: effect of covariate, t = 6.9, p ~ 8 x 10–11, effect of date/party, t = 1.27, p = 0.21. For (B), ANCOVA ln(Ka/Ks) versus party/date with log10(abundance) as a covariate: effect of covariate, t = 6.99, p ~ 5 x 10-11, effect of date/party, t=1.24, p = 0.21. Note that taking the log of the variables on the y-axis forces loss of two data points (one party, one date) with dN = 0. However, results are unaffected by using, for example, ln(0.1 + dN) and ln(0.1 + dN/dS), which permits their inclusion. Similarly the residuals from the fit of x versus y are no different for date and party hubs for ln(0.1 + dN) residuals of date are if anything lower than those for party (-0.026 versus 0.46 but not significantly so, p = 0.16, t-test; ln(0.1 + dN/dS) mean for date is −0.015, for party 0.027, p = 0.18). We have repeated the analysis using a different outgroup (S. bayanus), and still find no effect on covariate controlled analysis (unpublished data).
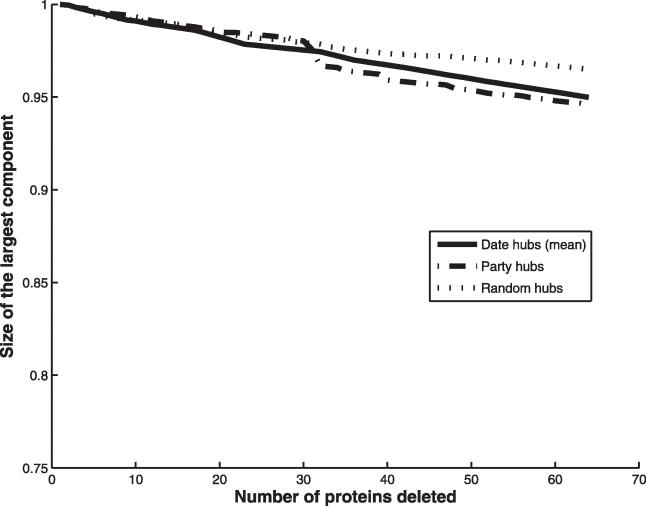
Date and party hub deletion effect on the integrity of the interaction network as measured by the relative size of the largest connected component (MCS) after deletion. Hubs were deleted in descending order by connectivity. Because the number of date hubs was much larger than number of party hubs (189 versus 64 respectively), we sampled the same number of date hubs as party hubs 200 times and determined the deletion effect each time. The mean effect of deletion of date hubs is plotted.
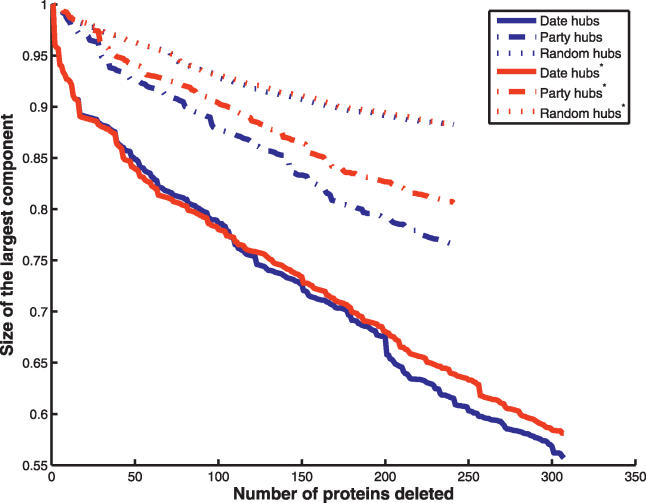
Lines in red are after 50% swap of hubs, in blue for the original case. Because hub swapping has no effect, connectivity (not position in the network) explains why date and party have apparently different effects upon deletion.
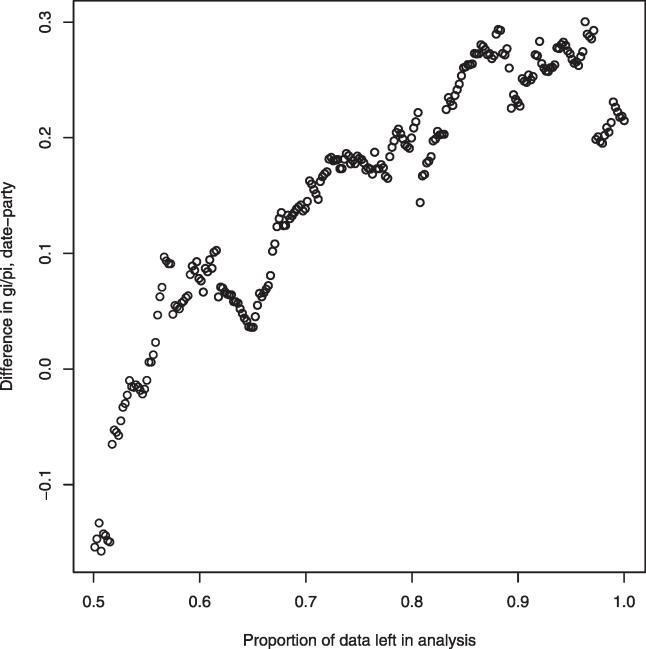
We define bias as the difference between the number of independent validations of a genetic interaction of a given protein and the actual, nonredundant genetic connectivity, normalised by the nonredundant genetic connectivity [14]. We rank ordered all genes according to their study bias. We then eliminated the most biased data point and recalculated the g
i/p
i difference in for date versus party hubs for the remaining genes (reported on the y-axis). We then removed the next most biased, and so forth. At 0.5 residual, half of the original 489 genes were left in the analysis. Purging of the most biased genes removes any tendency for party and date hubs to differ; any possible difference between party and date hubs is hence owing to study bias.
References
-
- Han JD, Bertin N, Hao T, Goldberg DS, Berriz GF, et al. Evidence for dynamically organized modularity in the yeast protein-protein interaction network. Nature. 2004;430:88–93. - PubMed
-
- Fraser HB. Modularity and evolutionary constraint on proteins. Nat Genet. 2005;37:351–352. - PubMed
-
- Gavin AC, Bosche M, Krause R, Grandi P, Marzioch M, et al. Functional organization of the yeast proteome by systematic analysis of protein complexes. Nature. 2002;415:141–147. - PubMed
-
- Gavin AC, Aloy P, Grandi P, Krause R, Boesche M, et al. Proteome survey reveals modularity of the yeast cell machinery. Nature. 2006;440:631–636. - PubMed
Publication types
MeSH terms
Substances
LinkOut - more resources
Full Text Sources
Molecular Biology Databases
