. 2007 Jul;81(1):17-31.
doi: 10.1086/518720. Epub 2007 May 29.

A genomewide screen for late-onset Alzheimer disease in a genetically isolated Dutch population

Affiliations

A genomewide screen for late-onset Alzheimer disease in a genetically isolated Dutch population

Fan Liu et al. Am J Hum Genet. 2007 Jul.

Abstract

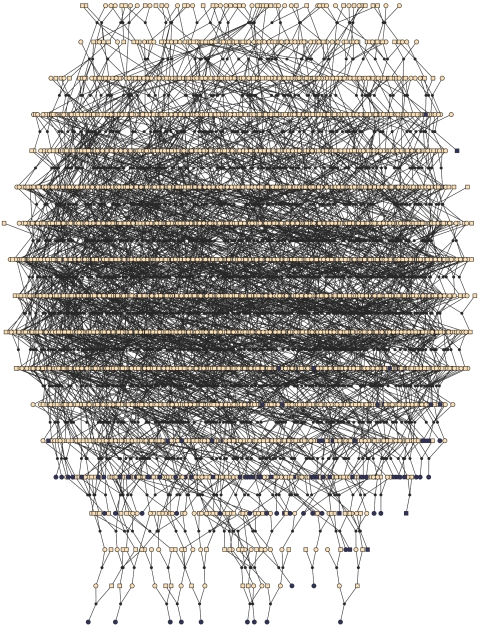
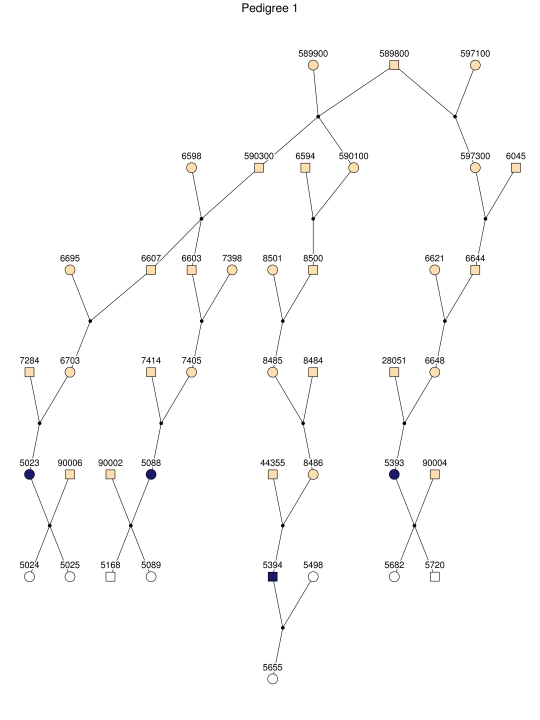
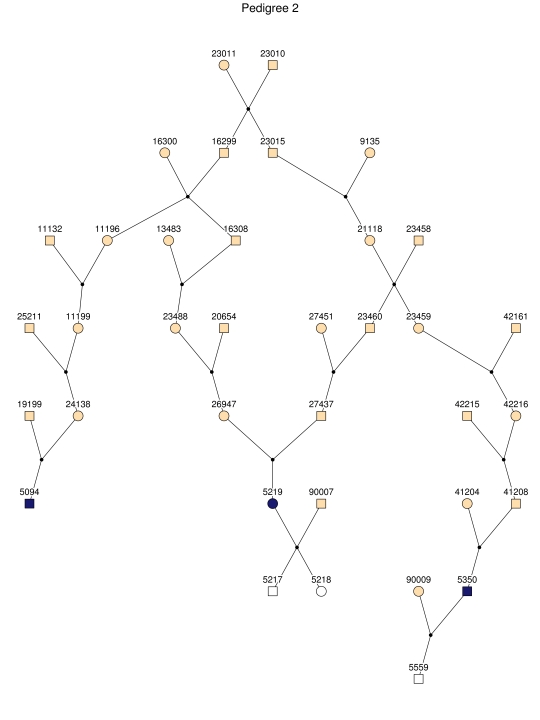
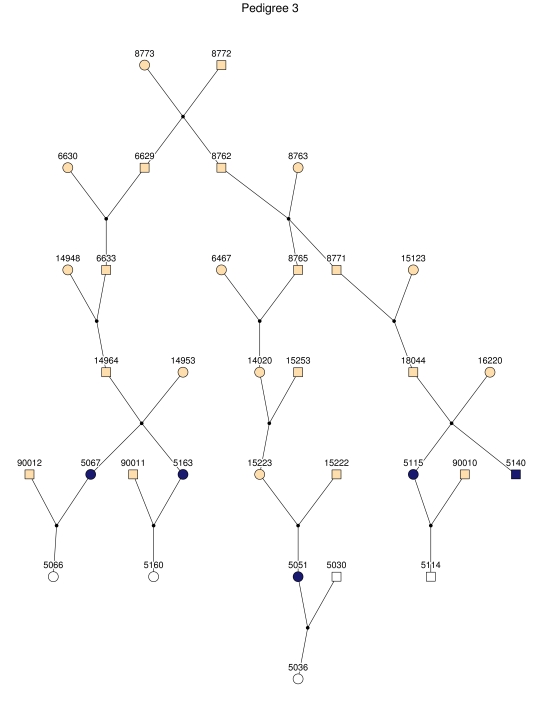
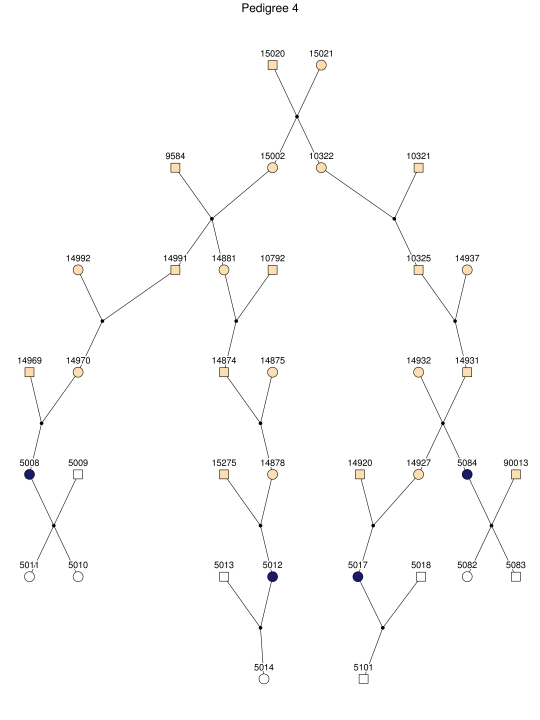
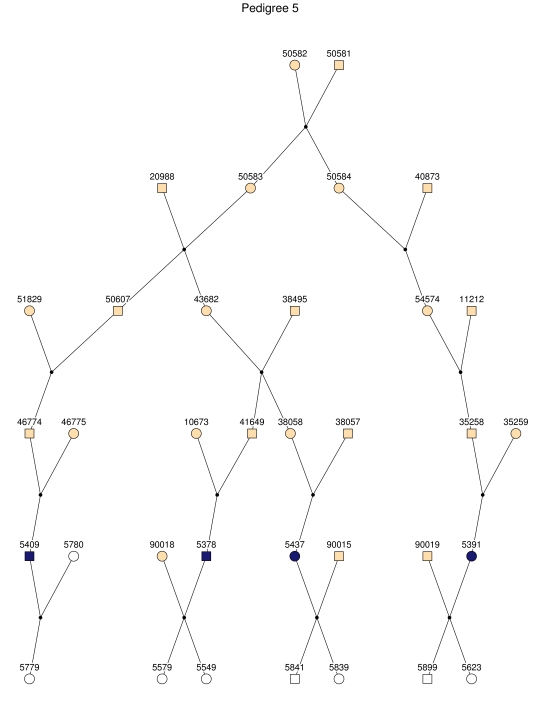
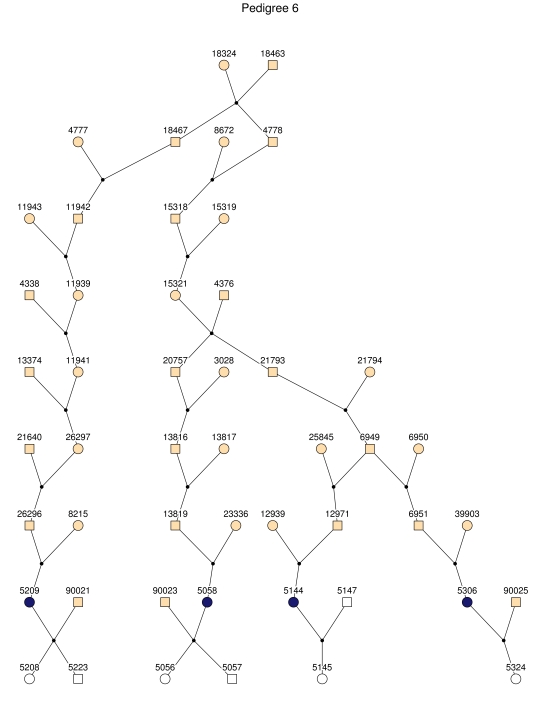
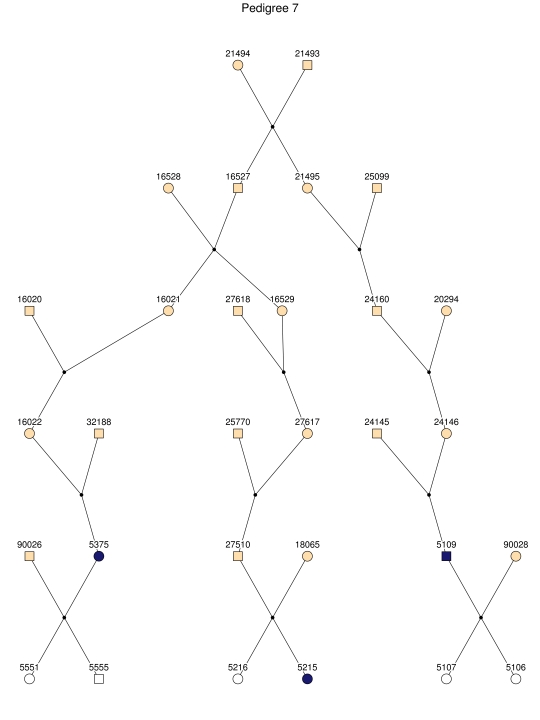
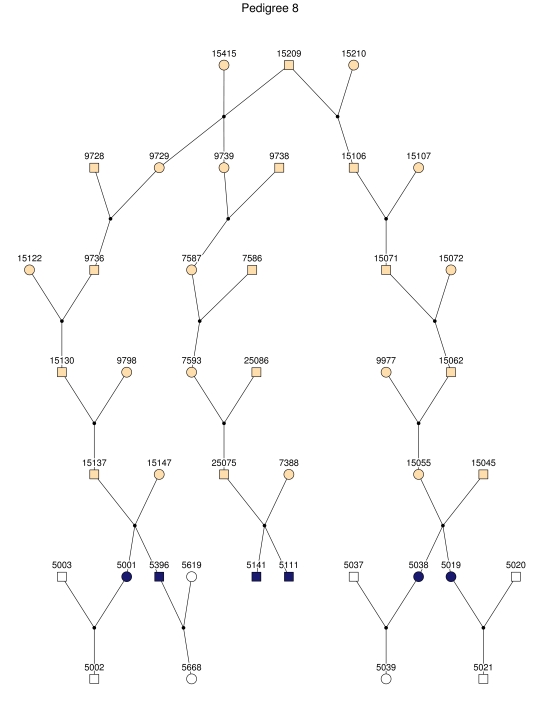
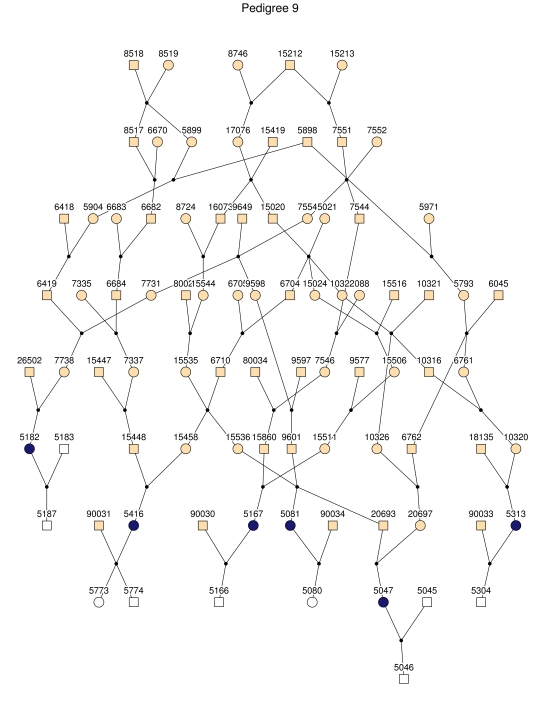
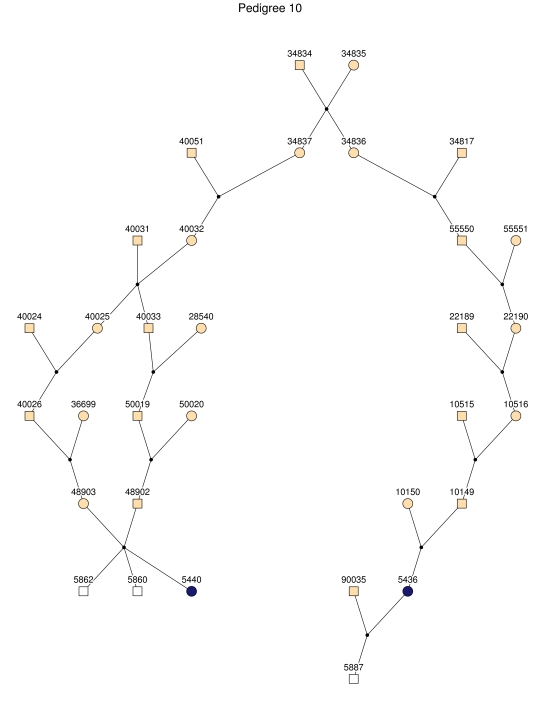
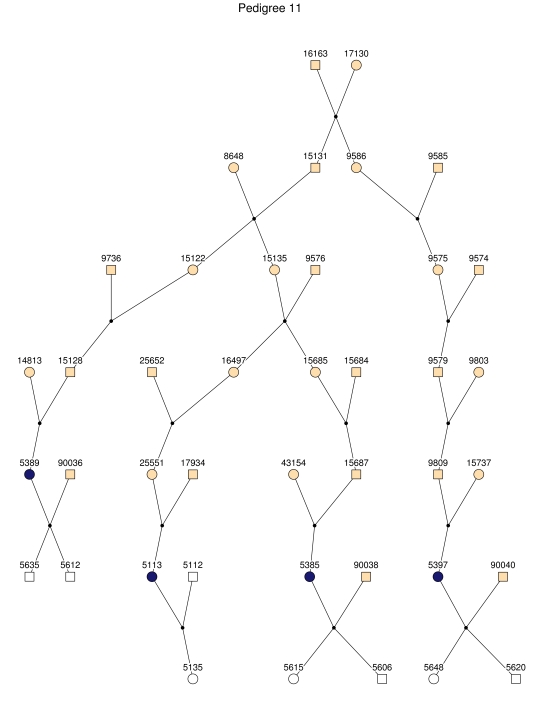
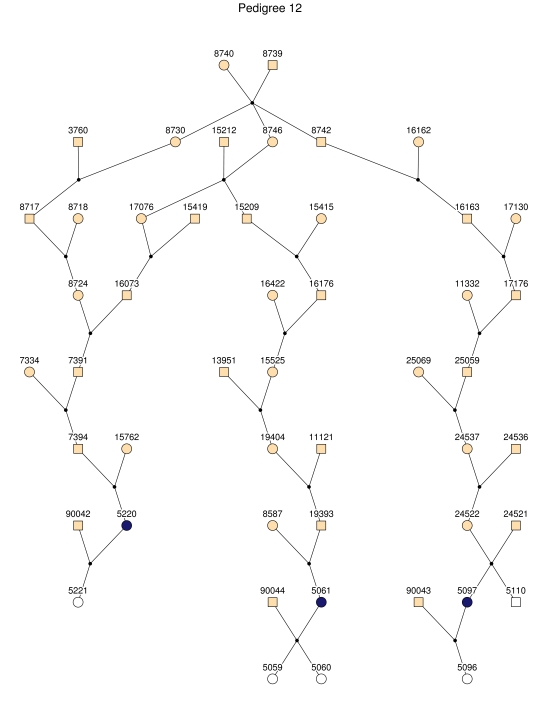
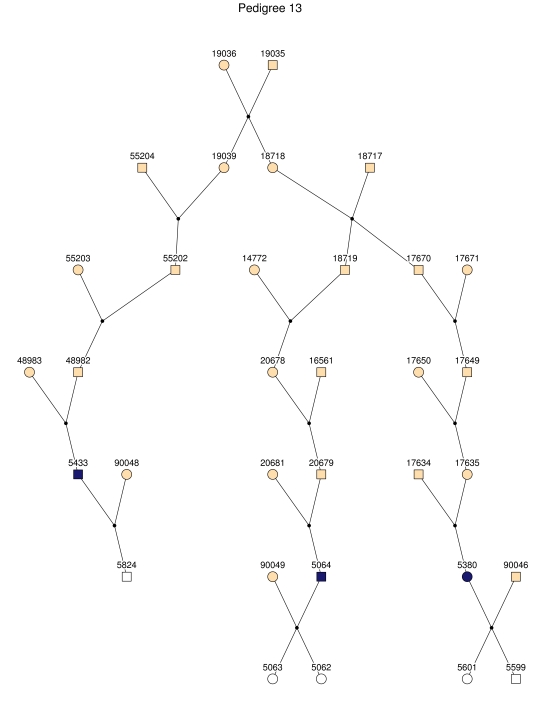
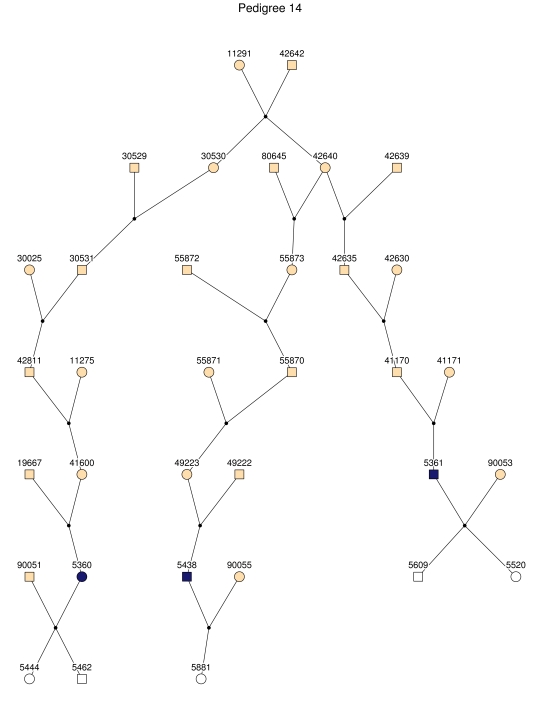
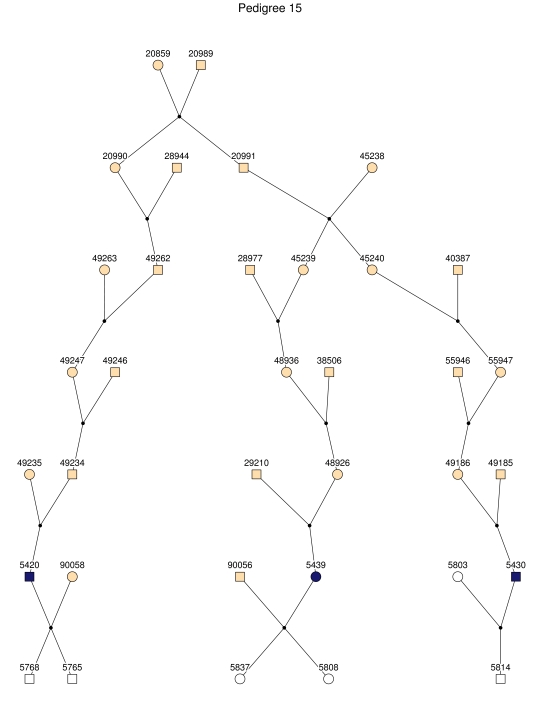
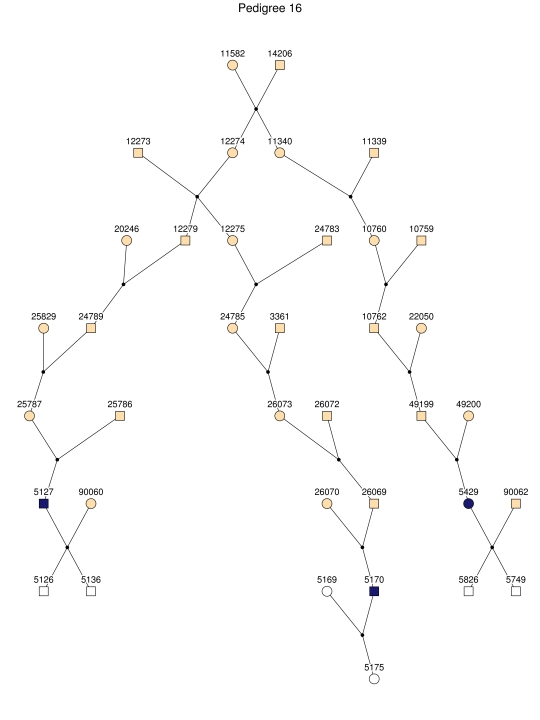
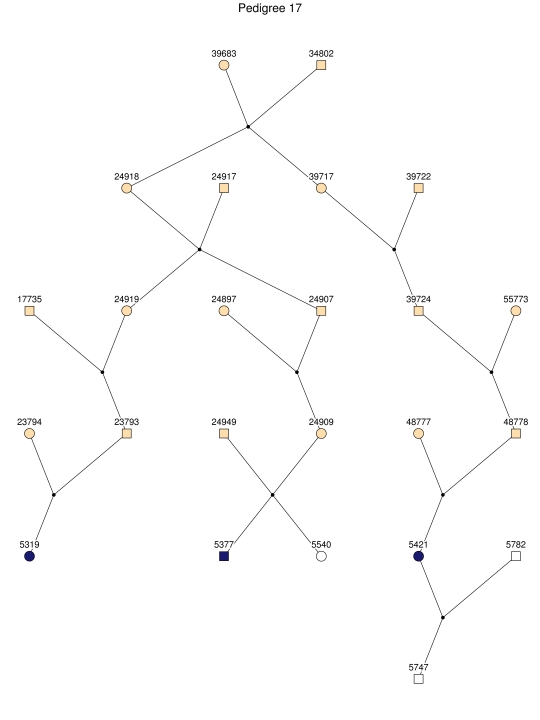
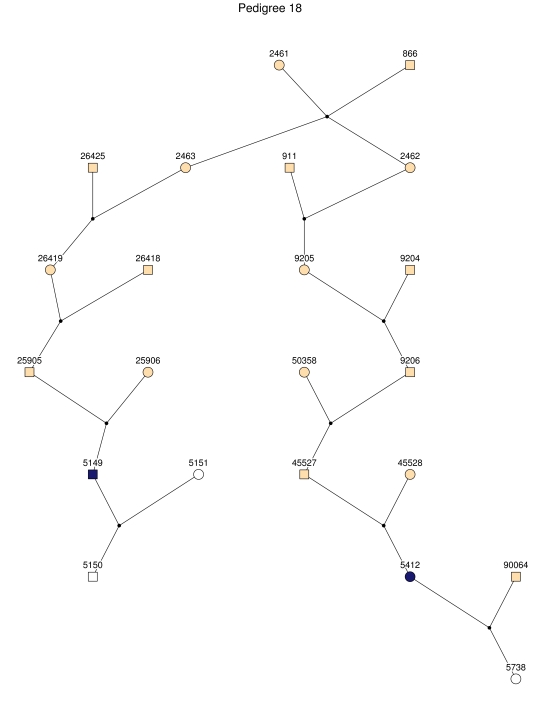
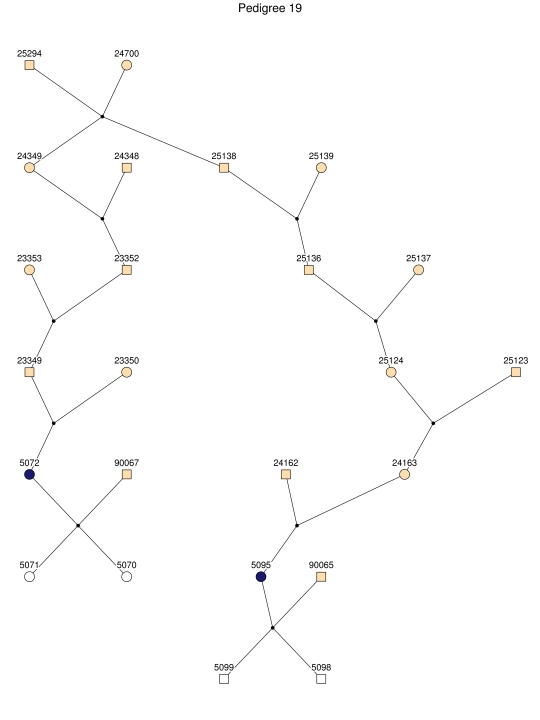
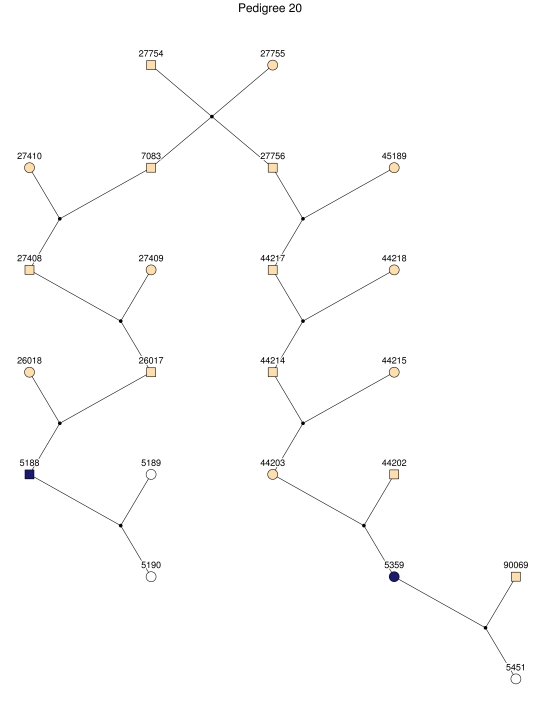
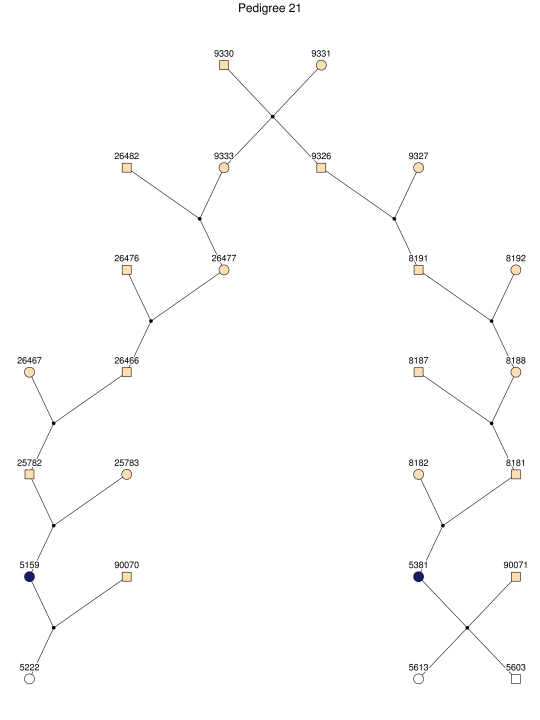
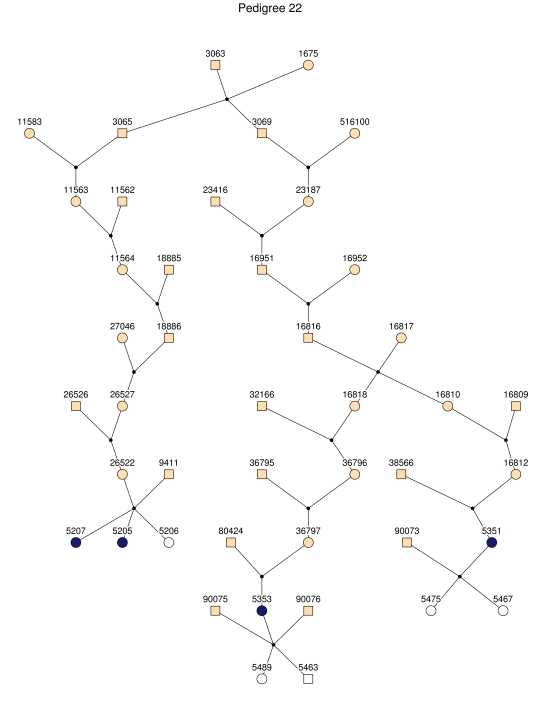
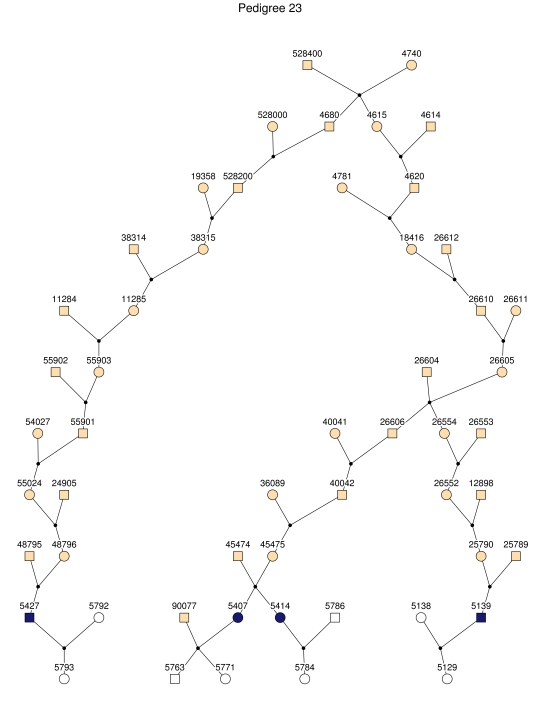
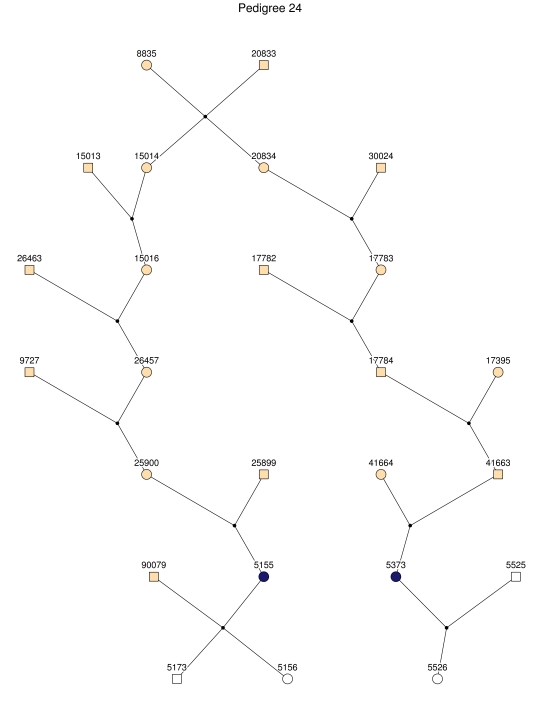
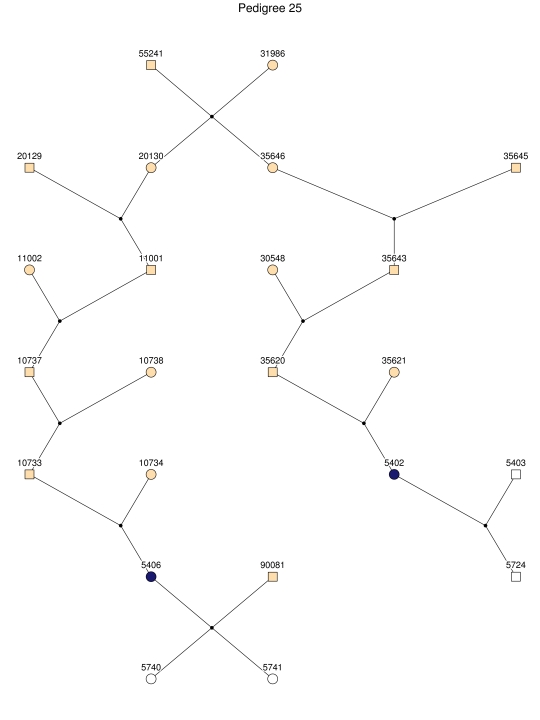
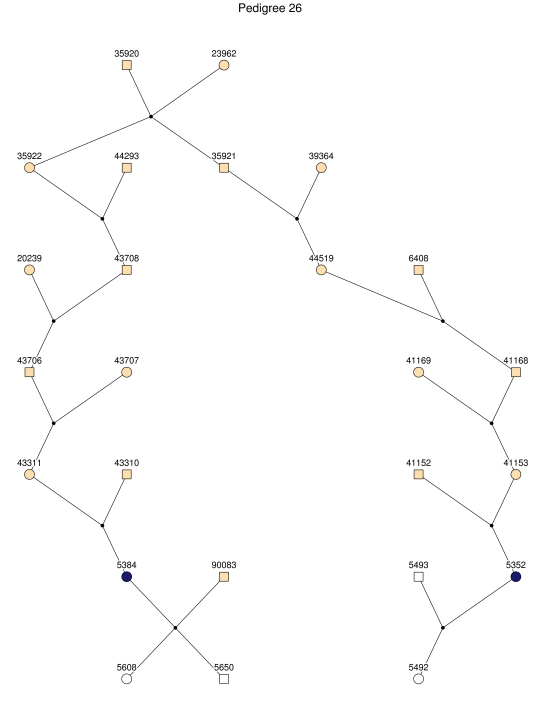
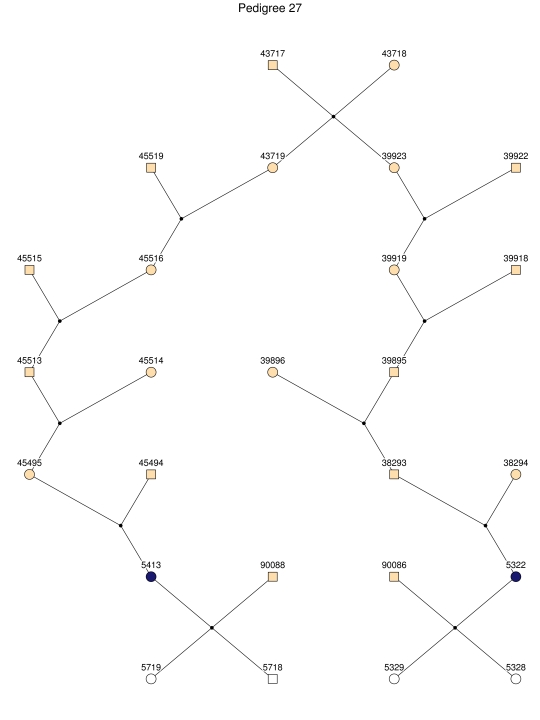
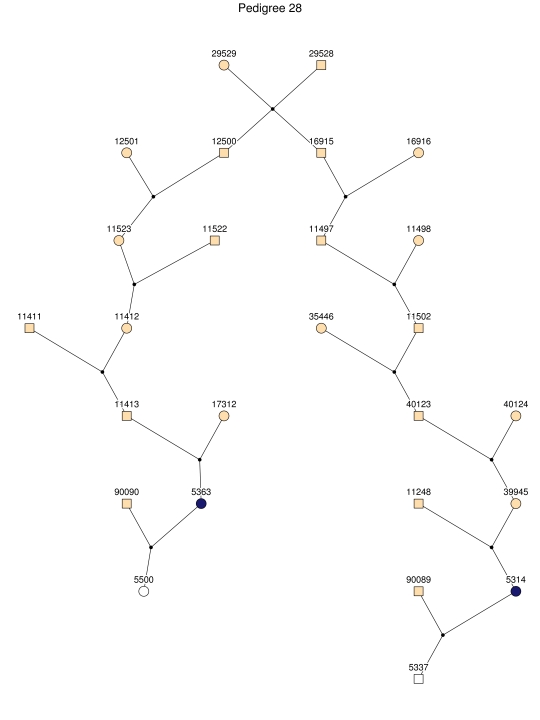
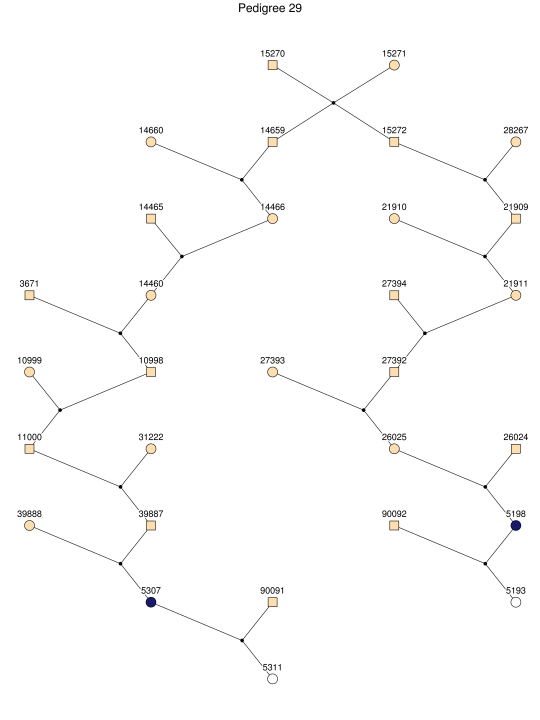
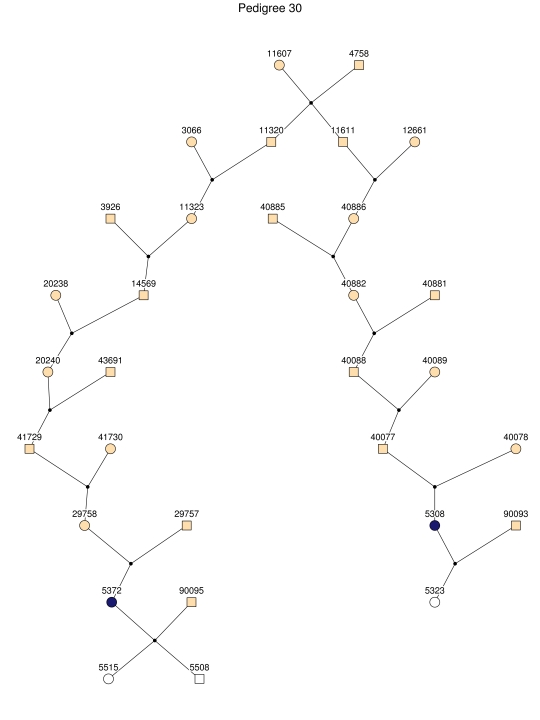
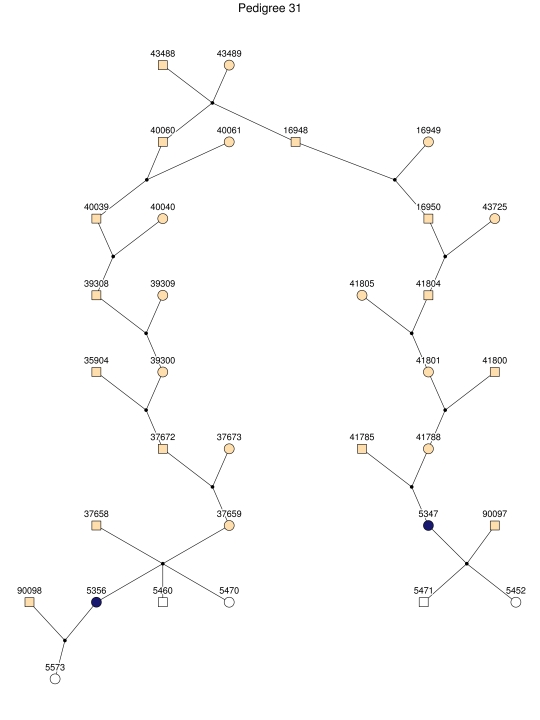
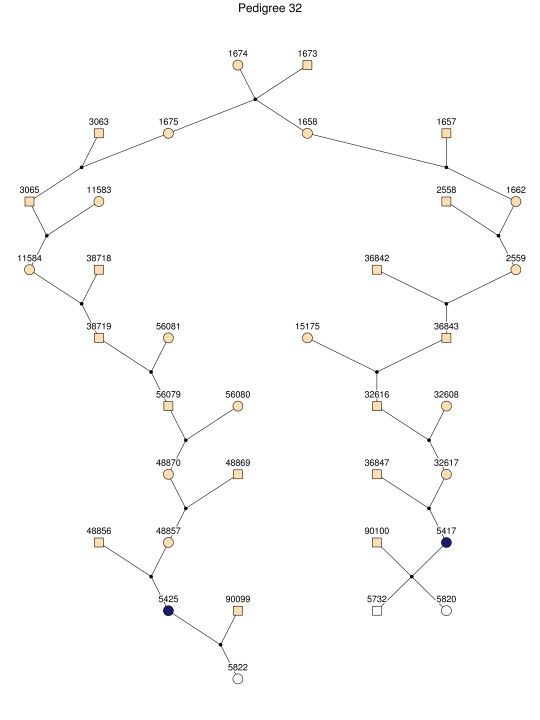
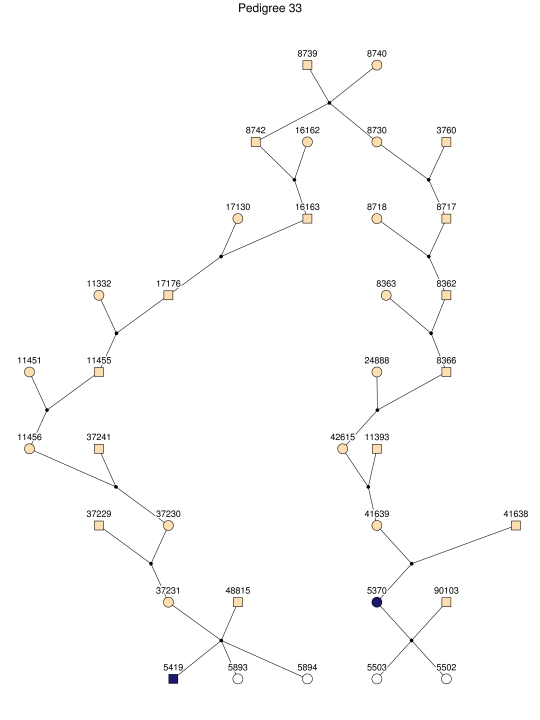
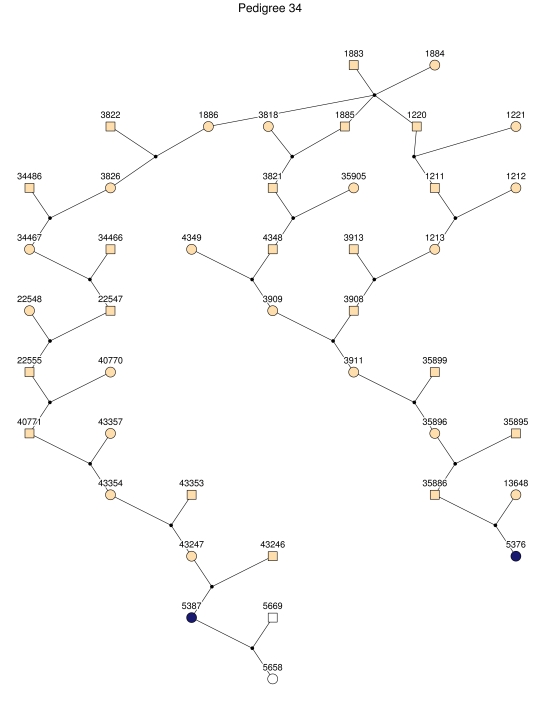
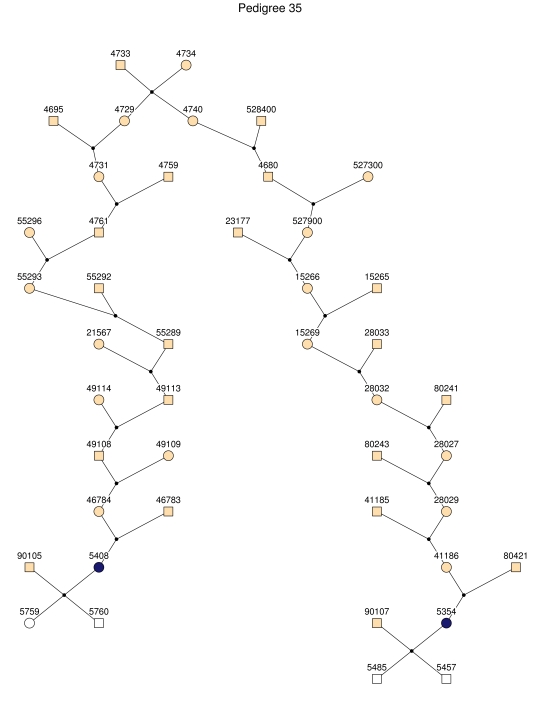
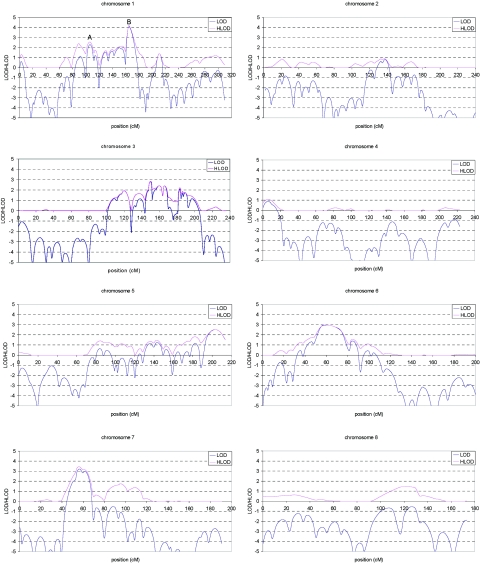
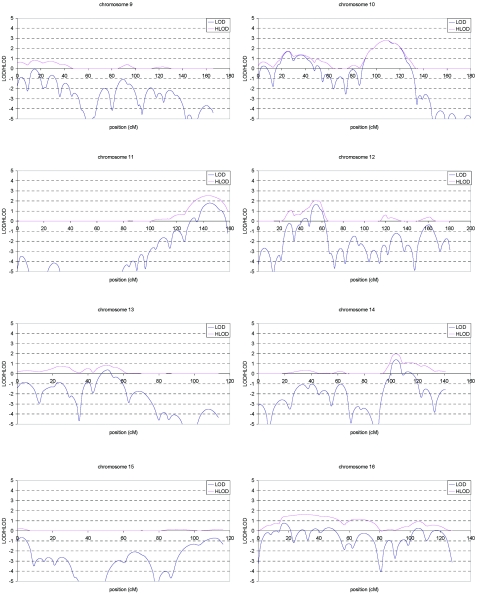
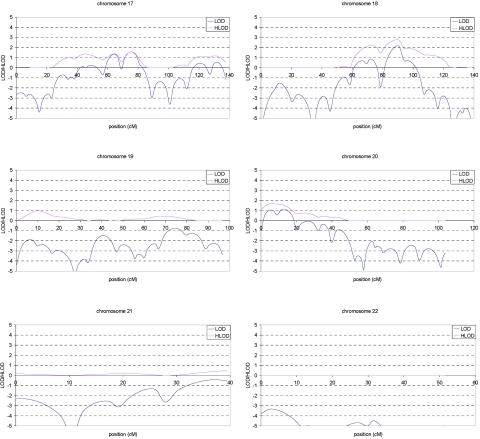
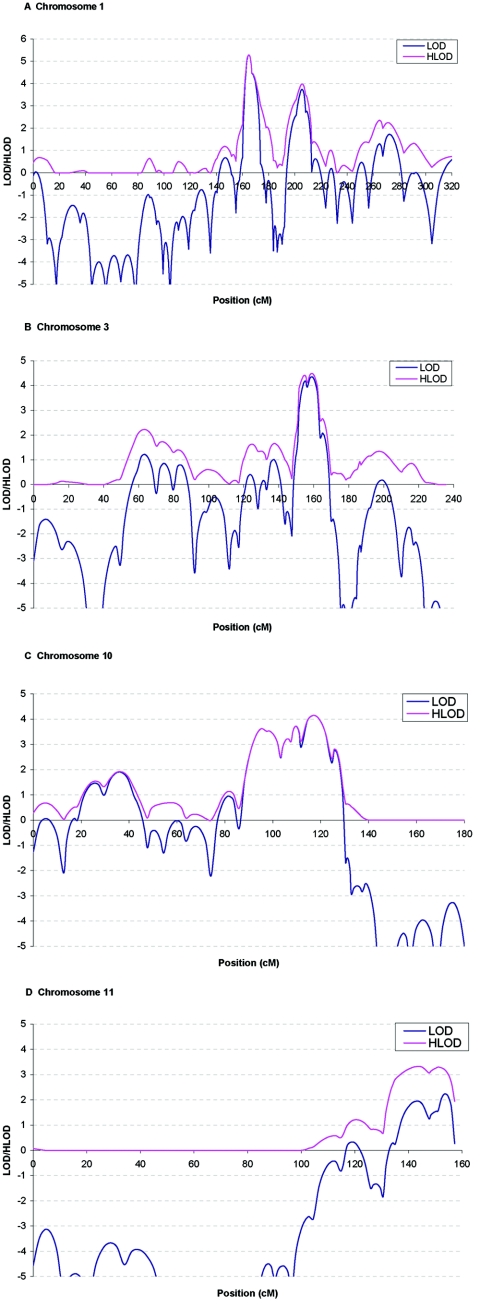
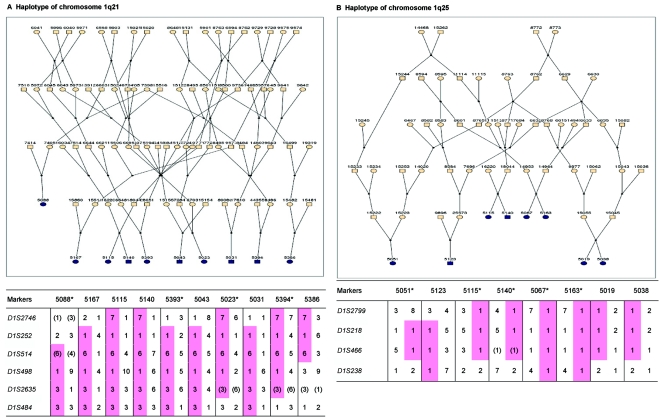
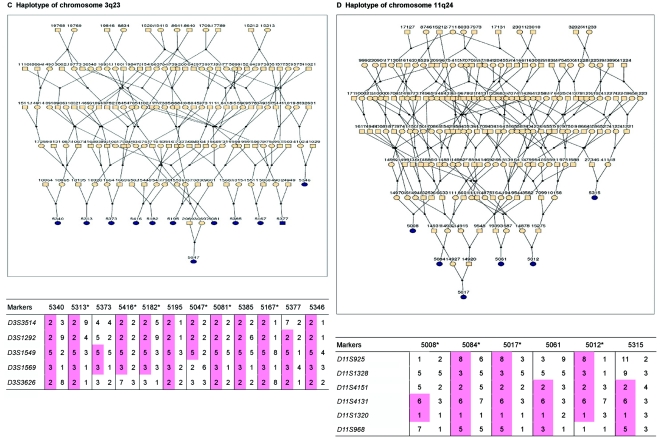
Alzheimer disease (AD) is the most common cause of dementia. We conducted a genome screen of 103 patients with late-onset AD who were ascertained as part of the Genetic Research in Isolated Populations (GRIP) program that is conducted in a recently isolated population from the southwestern area of The Netherlands. All patients and their 170 closely related relatives were genotyped using 402 microsatellite markers. Extensive genealogy information was collected, which resulted in an extremely large and complex pedigree of 4,645 members. The pedigree was split into 35 subpedigrees, to reduce the computational burden of linkage analysis. Simulations aiming to evaluate the effect of pedigree splitting on false-positive probabilities showed that a LOD score of 3.64 corresponds to 5% genomewide type I error. Multipoint analysis revealed four significant and one suggestive linkage peaks. The strongest evidence of linkage was found for chromosome 1q21 (heterogeneity LOD [HLOD]=5.20 at marker D1S498). Approximately 30 cM upstream of this locus, we found another peak at 1q25 (HLOD=4.0 at marker D1S218). These two loci are in a previously established linkage region. We also confirmed the AD locus at 10q22-24 (HLOD=4.15 at marker D10S185). There was significant evidence of linkage of AD to chromosome 3q22-24 (HLOD=4.44 at marker D3S1569). For chromosome 11q24-25, there was suggestive evidence of linkage (HLOD=3.29 at marker D11S1320). We next tested for association between cognitive function and 4,173 single-nucleotide polymorphisms in the linked regions in an independent sample consisting of 197 individuals from the GRIP region. After adjusting for multiple testing, we were able to detect significant associations for cognitive function in four of five AD-linked regions, including the new region on chromosome 3q22-24 and regions 1q25, 10q22-24, and 11q25. With use of cognitive function as an endophenotype of AD, our study indicates the that the RGSL2, RALGPS2, and C1orf49 genes are the potential disease-causing genes at 1q25. Our analysis of chromosome 10q22-24 points to the HTR7, MPHOSPH1, and CYP2C cluster. This is the first genomewide screen that showed significant linkage to chromosome 3q23 markers. For this region, our analysis identified the NMNAT3 and CLSTN2 genes. Our findings confirm linkage to chromosome 11q25. We were unable to confirm SORL1; instead, our analysis points to the OPCML and HNT genes.


Figures

Figure  1.
Figure 1.
The entire pedigree with 4,645 members, including 103 patients with late-onset AD, from the GRIP population. Men are represented with squares and women with circles. Black dots represent marriage nodes. Affected individuals are represented in black. Unknown affection status is represented with yellow. For simplicity, unaffected relatives of the patients are not shown. This figure was drawn using Pedfiddler version 0.5.
Figure  2.
Figure 2.
The 35 subpedigrees obtained by applying a kinship-partitioning algorithm to the entire pedigree. Affected individuals are shown with black squares and circles. Unaffected first-degree relatives of the patients were added to the subpedigrees and are represented with white squares and circles. Ancestors of the patients and relatives are shown with gray squares and circles.
Figure  3.
Figure 3.
Multipoint LOD (blue) and HLOD (pink) scores for each autosome in the genome screen of late-onset AD. Marker locations are given in Kosambi centimorgans.
Figure  3.
Figure 3.
Multipoint LOD (blue) and HLOD (pink) scores for each autosome in the genome screen of late-onset AD. Marker locations are given in Kosambi centimorgans.
Figure  3.
Figure 3.
Multipoint LOD (blue) and HLOD (pink) scores for each autosome in the genome screen of late-onset AD. Marker locations are given in Kosambi centimorgans.
Figure  4.
Figure 4.
Multipoint LOD (blue) and HLOD (pink) scores for chromosomes 1, 3, 10, and 11 in the genome screen of late-onset AD after fine typing. Marker locations are given in Kosambi centimorgans.
Figure  5.
Figure 5.
Haplotypes of chromosomes 1, 3, and 11 segregating with AD-affected families from the GRIP population. Panels A, B, C, and D are from subpedigrees 1, 3, 9, and 4, respectively. These families are expanded to depict the haplotype sharing of other patients who are relatively closely related to the patients but were assigned to different families in the pedigree-splitting procedure. Patients with asterisks (*) were from the corresponding subpedigrees; patients without asterisks were assigned to different families. Alleles in parentheses are inferred. Pink bars depict the segment that is shared between the patients.

References

Web Resources

    1. AlzGene Database and Alzheimer Research Forum, http://www.alzgene.org/
    1. GENEHUNTER, http://linkage.rockefeller.edu/soft/gh/ (for multipoint linkage analysis with the Lander-Green algorithm)
    1. Merlin, http://www.sph.umich.edu/csg/abecasis/Merlin/download/ (for detecting unlikely double-recombination events and haplotype construction)
    1. MGA, http://mga.bionet.nsc.ru/soft/index.html (for PedCut)
    1. Online Mendelian Inheritance in Man (OMIM), http://www.ncbi.nlm.nih.gov/Omim/ (for PSEN1, PSEN2, APP, APOE, ACE, CHRNB2, CST3, ESR1, GAPDHS, IDE, MTHFR, NCSTN, PRNP, TF, TFAM, TNF, SORL1, HTR7, CYP2C19, CYP2C9, NMNAT3, OPCML, HNT, CRP, BCHE, MME, SST, CH25H, PLAU, LIPA, CYP2C18, and CYP2C8)

References

    1. Ott A, Breteler MM, van Harskamp F, Claus JJ, van der Cammen TJ, Grobbee DE, Hofman A (1995) Prevalence of Alzheimer’s disease and vascular dementia: association with education. BMJ 310:970–973 - PMC - PubMed
    1. Rocca WA, Hofman A, Brayne C, Breteler MM, Clarke M, Copeland JR, Dartigues JF, Engedal K, Hagnell O, Heeren TJ, et al (1991) Frequency and distribution of Alzheimer’s disease in Europe: a collaborative study of 1980–1990 prevalence findings. Ann Neurol 30:381–39010.1002/ana.410300310 - DOI - PubMed
    1. Gatz M, Reynolds CA, Fratiglioni L, Johansson B, Mortimer JA, Berg S, Fiske A, Pedersen NL (2006) Role of genes and environments for explaining Alzheimer disease. Arch Gen Psychiatry 63:168–17410.1001/archpsyc.63.2.168 - DOI - PubMed
    1. Sherrington R, Rogaev EI, Liang Y, Rogaeva EA, Levesque G, Ikeda M, Chi H, Lin C, Li G, Holman K, et al (1995) Cloning of a gene bearing missense mutations in early-onset familial Alzheimer’s disease. Nature 375:754–76010.1038/375754a0 - DOI - PubMed
    1. Levy-Lahad E, Wasco W, Poorkaj P, Romano DM, Oshima J, Pettingell WH, Yu CE, Jondro PD, Schmidt SD, Wang K, et al (1995) Candidate gene for the chromosome 1 familial Alzheimer’s disease locus. Science 269:973–97710.1126/science.7638622 - DOI - PubMed

Publication types