. 2007 Jul;81(1):53-66.
doi: 10.1086/518670. Epub 2007 May 15.

Identification of risk-related haplotypes with the use of multiple SNPs from nuclear families

Affiliations

Identification of risk-related haplotypes with the use of multiple SNPs from nuclear families

Min Shi et al. Am J Hum Genet. 2007 Jul.

Abstract

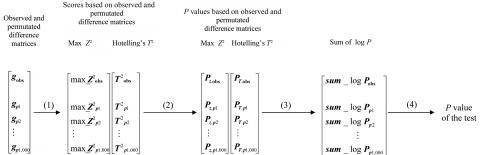
Family-based association studies offer robustness to population stratification and can provide insight into maternally mediated and parent-of-origin effects. Usually, such studies investigate multiple markers covering a gene or chromosomal region of interest. We propose a simple and general method to test the association of a disease trait with multiple, possibly linked SNP markers and, subsequently, to nominate a set of "risk-haplotype-tagging alleles." Our test, the max_Zeta(2) test, uses only the genotypes of affected individuals and their parents without requiring the user to either know or assign haplotypes and their phases. It also accommodates sporadically missing SNP data. In the spirit of the pedigree disequilibrium test, our procedure requires only a vector of differences with expected value 0 under the null hypothesis. To enhance power against a range of alternatives when genotype data are complete, we also consider a method for combining multiple tests; here, we combine max_Zeta(2) and Hotelling's Gamma(2). To facilitate discovery of risk-related haplotypes, we develop a simple procedure for nominating risk-haplotype-tagging alleles. Our procedures can also be used to study maternally mediated genetic effects and to explore imprinting. We compare the statistical power of several competing testing procedures through simulation studies of case-parents triads, whose diplotypes are simulated on the basis of draws from the HapMap-based known haplotypes of four genes. In our simulations, the max_Zeta(2) test and the max_TDT (transmission/disequilibrium test) proposed by McIntyre et al. perform almost identically, but max_Zeta(2), unlike max_TDT, extends directly to the investigation of maternal effects. As an illustration, we reanalyze data from a previously reported orofacial cleft study, to now investigate both fetal and maternal effects of the IRF6 gene.


Figures

Figure  B1.
Figure B1.
A flow chart of the combined test approach. Schematic of the sum_log(P) procedure for combining max_Z2 and Hotelling’sT2 tests. We use the subscript “obs” to represent observed data (or scores calculated on the basis of the observed data) and the subscripts “p1”…“p1,000” to represent permutation data (or scores calculated on the basis of the permutation data), assuming 1,000 permutations.
Figure  D1.
Figure D1.
The average number of risk-haplotype-tagging SNPs for NAT2 simulations that reached global significance in the SNP_typed, SNP_not_typed, and Hap scenarios. The relative risks are R1=2, R2=3, and each successive background haplotype is used as the mutation-bearing or risk haplotype. Haplotypes with identical frequencies were shifted slightly for better visualization. Left column, 400 triads. Right column, 1,000 triads. Top row, SNP_typed. Middle row, SNP_not_typed. Bottom row, Hap. Lines with asterisks indicate simulations that uniquely identified the correct haplotype. Lines with unblackened squares indicate simulations that identified the correct haplotype either uniquely or with some other haplotypes.
Figure  1.
Figure 1.
Power curves for NAT2 in the SNP_typed, SNP_not_typed, and Hap scenarios with R1=2, R2=3 with the use of each successive background haplotype as the mutation-bearing or risk haplotype. The eight most frequent risk haplotypes are given in descending order of frequency, with the X-axis scale of log10[1/frequency] labeled as “1/Frequency.” These frequencies are for the mutation-bearing haplotype or risk haplotype. Haplotypes with identical frequencies were shifted slightly for better visualization, as indicated by the arrows. Left column, 400 triads. Right column, 1,000 triads. Top row, SNP_typed. Middle row, SNP_not_typed. Bottom row, Hap. Lines with unblackened triangles indicate max_Z2; lines with unblackened diamonds indicate sum_log(P); lines with “T” indicate max_TDT; lines with blackened squares indicate Hotelling's T2; lines with blackened triangles indicate APRICOT.
Figure  2.
Figure 2.
Power curves for RFC1 (A), POLI (B), and CASP9 (C) in the SNP_typed and SNP_not_typed scenarios with R1=2,R2=3 with the use of each successive background haplotype as the mutation-bearing or risk haplotype. The eight most frequent risk haplotypes are given in descending order of frequency, with the X-axis scale of log10[1/frequency] labeled as “1/Frequency.” These frequencies are for the mutation-bearing haplotype or risk haplotype. Haplotypes with identical frequencies were shifted slightly for better visualization, as indicated by the arrows. a, 400 triads, SNP_typed. b, 1,000 triads, SNP_typed. c, 400 triads, SNP_not_typed. d, 1,000 triads, SNP_not_typed. Lines with unblackened triangles indicate max_Z2; lines with unblackened diamonds indicate sum_log(P); lines with “T” indicate max_TDT; lines with blackened squares indicate Hotelling's T2; lines with blackened triangles indicate APRICOT.
Figure  3.
Figure 3.
Risk haplotype nomination for NAT2 in the SNP_typed, SNP_not_typed, and Hap scenarios with R1=2, R2=3. Results are based on simulations with global significance at P⩽.05 and cutoff criterion P<.1. Left panel, 400 triads. Right panel, 1,000 triads. Top row, SNP_typed. Middle row, SNP_not_typed. Bottom row, Hap. Each column represents a successive haplotype as the mutation-bearing or risk haplotype, sorted by descending order of frequency along the X-axis. The white line represents the power curve for sum_log(P) and indicates the fraction of 5,000 simulated studies reaching global significance. From bottom to top, the different shades represent the proportion of simulations where the correct haplotype was uniquely identified (dark gray), the risk-haplotype-tagging alleles were consistent with a set of haplotypes that included the correct one (medium gray), the risk-haplotype-tagging alleles did not agree with any existing haplotype (light gray), or the risk-haplotype-tagging alleles agreed with only the nonrisk haplotypes (white).
Figure  4.
Figure 4.
Risk-haplotype nomination for RFC1 (A), POLI (B), and CASP9 (C) in the SNP_typed and SNP_not_typed scenarios with R1=2, R2=3. Results are based on simulations with global significance at P⩽.05 and cutoff criterion P<.1. a, 400 triads, SNP_typed. b, 1,000 triads, SNP_typed. c, 400 triads, SNP_not_typed. d, 1,000 triads, SNP_not_typed. Each column represents a successive haplotype as the mutation-bearing or risk haplotype, sorted by descending order of frequency along the X-axis. The white line represents the power curve for sum_log(P) and indicates the fraction of 5,000 simulated studies reaching global significance. From bottom to top, the different shades represent the proportion of simulations where the correct haplotype was uniquely identified (dark gray), the risk-haplotype-tagging alleles were consistent with a set of haplotypes that included the correct one (medium gray), the risk-haplotype-tagging alleles did not agree with any existing haplotype (light gray), or the risk-haplotype-tagging alleles agreed with only the nonrisk haplotypes (white).
Figure  5.
Figure 5.
Orofacial cleft examples. Result of testing effects of offspring genotype (A) and maternal genotype (B) for IRF6. The Y-axis shows –log10(p) at individual SNPs; the X-axis shows the physical location of the nominated risk-haplotype-tagging SNPs along with the number of informative families. The vertical lines represent either a rare allele on the risk haplotype at the corresponding SNPs (lines with unblackened circles) or a common allele (lines without unblackened circles). The nine boxed SNPs correspond to the nine identified by Zucchero et al. The dotted horizontal lines correspond to the P=.05 and P=.1 cutoffs.

Similar articles

Cited by

References

Web Resources

    1. Clarice R. Weinberg's Web site, http://dir.niehs.nih.gov/dirbb/weinberg/weinberg.htm (for software for the triad multimarker [TRIMM] test)
    1. GAIN, http://www.fnih.org/GAIN/GAIN_home.shtml
    1. HapMap, http://www.hapmap.org
    1. Online Mendelian Inheritance in Man (OMIM), http://www.ncbi.nlm.nih.gov/Omim/ (for NAT2, RFC1, POLI, CASP9, and IRF6)

References

    1. Zaykin DV, Westfall PH, Young SS, Karnoub MA, Wagner MJ, Ehm MG (2002) Testing association of statistically inferred haplotypes with discrete and continuous traits in samples of unrelated individuals. Hum Hered 53:79–9110.1159/000057986 - DOI - PubMed
    1. Morris RW, Kaplan NL (2002) On the advantage of haplotype analysis in the presence of multiple disease susceptibility alleles. Genet Epidemiol 23:221–23310.1002/gepi.10200 - DOI - PubMed
    1. Roeder K, Bacanu SA, Sonpar V, Zhang X, Devlin B (2005) Analysis of single-locus tests to detect gene/disease associations. Genet Epidemiol 28:207–21910.1002/gepi.20050 - DOI - PubMed
    1. Schaid DJ (2004) Evaluating associations of haplotypes with traits. Genet Epidemiol 27:348–36410.1002/gepi.20037 - DOI - PubMed
    1. Spielman RS, McGinnis RE, Ewens WJ (1993) Transmission test for linkage disequilibrium: the insulin gene region and insulin-dependent diabetes mellitus (IDDM). Am J Hum Genet 52:506–516 - PMC - PubMed

Publication types

Substances