. 2008 Jan;28(1):135-48.
doi: 10.1038/sj.jcbfm.9600518. Epub 2007 Jun 13.

A genomic comparison of in vivo and in vitro brain microvascular endothelial cells

Affiliations

A genomic comparison of in vivo and in vitro brain microvascular endothelial cells

Anthony R Calabria et al. J Cereb Blood Flow Metab. 2008 Jan.

Abstract

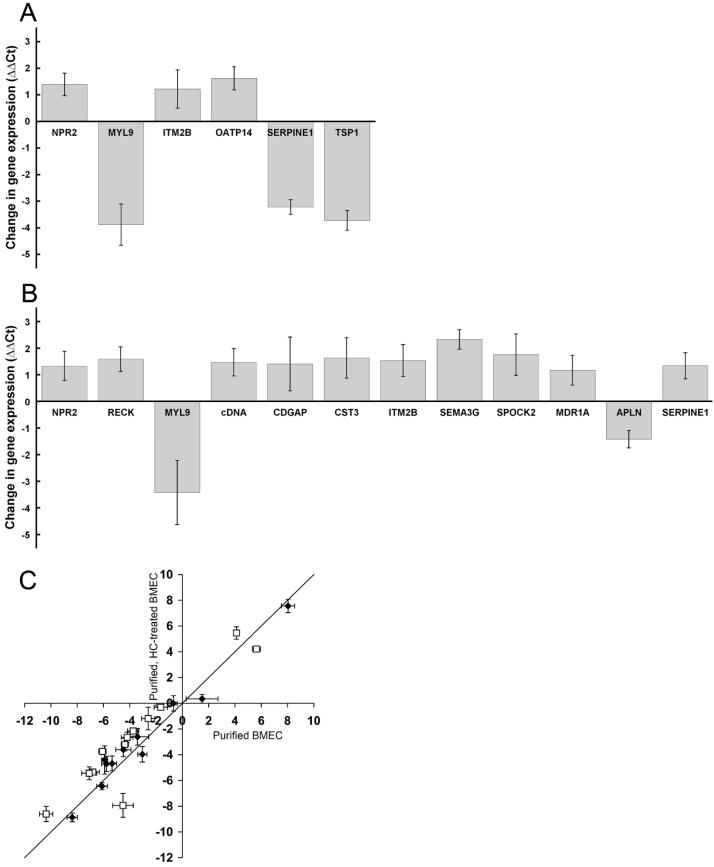
The blood-brain barrier (BBB) is composed of uniquely differentiated brain microvascular endothelial cells (BMEC). Often, it is of interest to replicate these attributes in the form of an in vitro model, and such models are widely used in the research community. However, the BMEC used to create in vitro BBB models de-differentiate in culture and lose many specialized characteristics. These changes are poorly understood at a molecular level, and little is known regarding the consequences of removing BMEC from their local in vivo microenvironment. To address these issues, suppression subtractive hybridization (SSH) was used to identify 25 gene transcripts that were differentially expressed between in vivo and in vitro BMEC. Genes affected included those involved in angiogenesis, transport and neurogenesis, and real-time quantitative polymerase chain reaction (qPCR) verified transcripts were primarily and significantly downregulated. Since this quantitative gene panel represented those BMEC characteristics lost upon culture, we used it to assess how culture manipulation, specifically BMEC purification and barrier induction by hydrocortisone, influenced the quality of in vitro models. Puromycin purification of BMEC elicited minimal differences compared with untreated BMEC, as assessed by qPCR. In contrast, qPCR-based gene panel analysis after induction with hydrocortisone indicated a modest shift of 10 of the 23 genes toward a more 'in vivo-like' gene expression profile, which correlated with improved barrier phenotype. Genomic analysis of BMEC de-differentiation in culture has thus yielded a functionally diverse set of genes useful for comparing the in vitro and in vivo BBB.


Figures

FIG. 1
FIG. 1
Flow chart detailing the steps performed to generate the SSH-derived gene panel. Messenger RNA was isolated from rat brain microvessels to generate a sample representing BMEC gene expression within the in vivo blood-brain barrier (BBB). Messenger RNA was also isolated from cultured brain microvascular endothelial cells to generate a sample representing BMEC gene expression in the in vitro BBB. The genomic technique suppression subtractive hybridization was used to remove commonly expressed mRNA transcripts between these two samples, and to identify those transcripts that were differentially-expressed. These differentially-expressed genes comprised a gene panel representing the molecular level differences between in vivo and in vitro BMEC. The gene panel was further employed to assess the effects of two separate culture conditions. One condition involved the purification of BMEC cultures using puromycin. The other condition examined the effects of purified BMEC barrier induction with hydrocortisone. Scale bars represent 50 μm.
FIG. 2
FIG. 2
Sample preparation and validation of the suppression subtraction hybridization (SSH) procedure. (A) Purified rat brain microvessels stained with o-toluidine blue. Scale bar represents 50 μm. (B) Rat brain microvascular endothelial cells cultured for 4.0 days in vitro without puromycin treatment. Phase image was overlayed by an image of the same field immunolabeled with an antibody against α-actin (artificially colored black). Scale bar represents 50 μm. (C) Northern blotting of poly A+ RNA from freshly isolated brain microvessels (lane 1) and cultured BMEC (lane 2) using an actin probe. Bands seen at 2.1 kb correspond to β-actin and the band seen at 1.6 kb corresponds to α-actin derived from smooth muscle cells in the in vivo sample and pericytes or smooth muscle cells in the in vitro sample. (D) Verification of SSH subtraction efficiency. The GAPDH gene was amplified by PCR for the unsubtracted in vivo (lanes 1-4) and in vitro (lanes 9-12) or subtracted in vivo (lanes 5-8) and in vitro (lanes 13-16) products from the SSH procedure. The lack of significant PCR product before 33 PCR cycles in the subtracted products indicates the success of the subtraction procedure.
FIG. 3
FIG. 3
Analysis of BMEC culture conditions using the gene panel and qPCR. (A) Statistically significant changes in gene expression levels between puromycin-purified (~100% BMEC) and untreated BMEC cultures (ΔΔCt, p<0.05). Gene transcripts not exhibiting statistically significant changes were excluded from the plot. (B) Statistically significant changes in gene expression levels between puromycin/hydrocortisone (HC)-treated BMEC and puromycin-treated BMEC cultures. Again, only those genes exhibiting statistically significant changes are depicted (ΔΔCt, p<0.05). (C) Comparison of gene expression levels between puromycin/HC-treated BMEC, puromycin-treated BMEC, and the in vivo BBB. Plotted are the ΔΔCt values comparing each in vitro condition to the in vivo case, with each data point representing a different gene transcript. Thus, a solid line of slope one represents equivalent gene expression levels between the two in vitro samples with reference to the in vivo case. The open squares are data points corresponding to genes with statistically significant (p < 0.05) differences in expression between the HC-treated and control culture condition, and the distance from the x-axis represents the quantitative differences in gene expression between the HC-treated BMEC and the in vivo BBB. Note that upon HC treatment, many of the open squares are shifted towards the x-axis, and hence towards in vivo gene expression levels. The solid diamonds are transcripts with statistically insignificant changes upon HC treatment, and therefore these points lie very close to the line with a slope of unity. Each value in panels A-C represents the mean ± standard deviation of triplicate biological samples. Results are representative of two independent experiments with independent mRNA samples. Throughout whole figure, positive and negative values of ΔΔCt represent genes upregulated and downregulated by indicated treatment, respectively.

References

    1. Betz AL, Firth JA, Goldstein GW. Polarity of the blood-brain barrier: distribution of enzymes between the luminal and antiluminal membranes of brain capillary endothelial cells. Brain Res. 1980;192:17–28. - PubMed
    1. Boado RJ, Wang L, Pardridge WM. Enhanced expression of the blood-brain barrier GLUT1 glucose transporter gene by brain-derived factors. Brain Res Mol Brain Res. 1994;22:259–267. - PubMed
    1. Butt AM, Jones HC, Abbott NJ. Electrical resistance across the blood-brain barrier in anaesthetized rats: a developmental study. J Physiol. 1990;429:47–62. - PMC - PubMed
    1. Calabria AR, Shusta EV. Blood-brain barrier genomics and proteomics: elucidating phenotype, identifying disease targets and enabling brain drug delivery. Drug Discov Today. 2006;11:792–799. - PubMed
    1. Calabria AR, Weidenfeller C, Jones AR, de Vries HE, Shusta EV. Puromycin-purified rat brain microvascular endothelial cell cultures exhibit improved barrier properties in response to glucocorticoid induction. J Neurochem. 2006;97:922–933. - PubMed

Publication types

MeSH terms

LinkOut - more resources