Comparative Study
. 2007 Jun 12:8:166.
doi: 10.1186/1471-2164-8-166.

Characterization of microRNA expression profiles in normal human tissues

Affiliations
Comparative Study

Characterization of microRNA expression profiles in normal human tissues

Yu Liang et al. BMC Genomics. .

Abstract

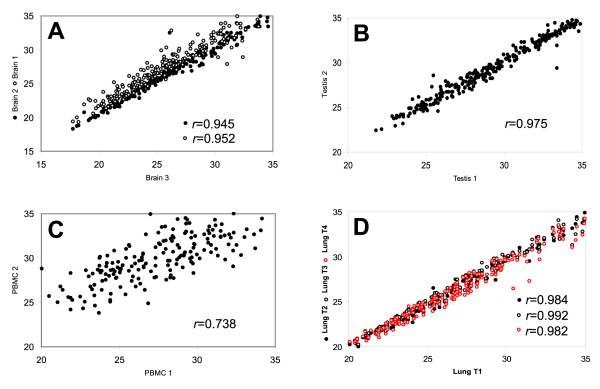
Background: Measuring the quantity of miRNAs in tissues of different physiological and pathological conditions is an important first step to investigate the functions of miRNAs. Matched samples from normal state can provide essential baseline references to analyze the variation of miRNA abundance.

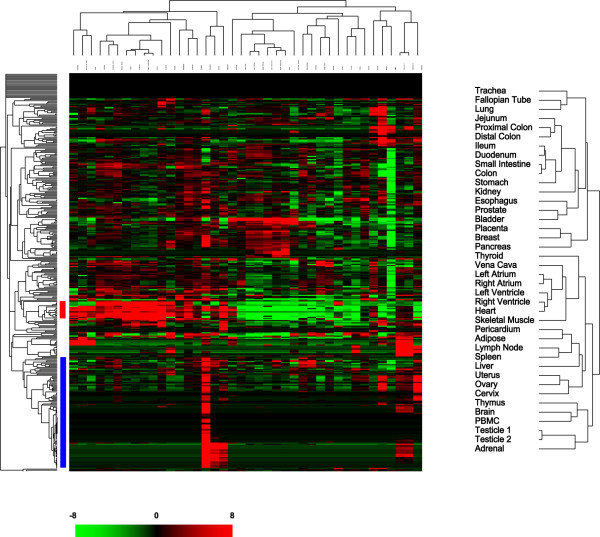
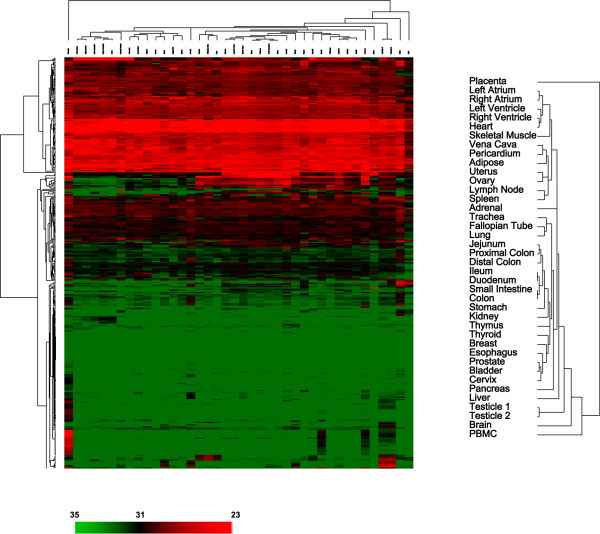
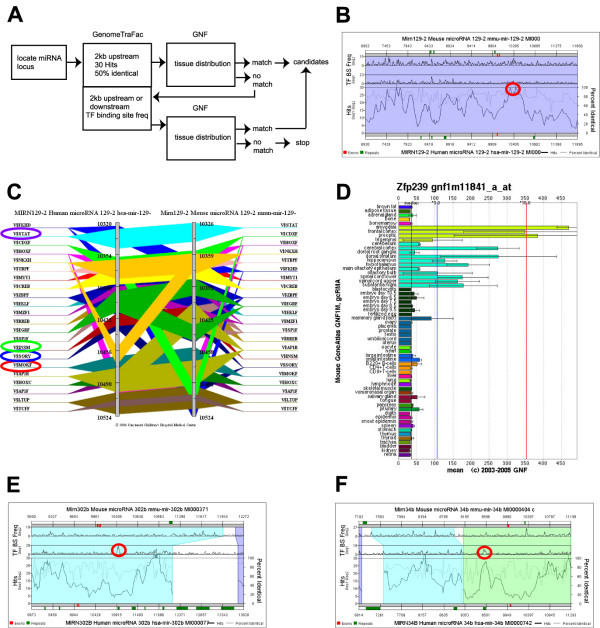
Results: We provided expression data of 345 miRNAs in 40 normal human tissues, which identified universally expressed miRNAs, and several groups of miRNAs expressed exclusively or preferentially in certain tissue types. Many miRNAs with co-regulated expression patterns are located within the same genomic clusters, and candidate transcriptional factors that control the pattern of their expression may be identified by a comparative genomic strategy. Hierarchical clustering of normal tissues by their miRNA expression profiles basically followed the structure, anatomical locations, and physiological functions of the organs, suggesting that functions of a miRNA could be appreciated by linking to the biologies of the tissues in which it is uniquely expressed. Many predicted target genes of miRNAs that had specific reduced expression in brain and peripheral blood mononuclear cells are required for embryonic development of the nervous and hematopoietic systems based on database search.

Conclusion: We presented a global view of tissue distribution of miRNAs in relation to their chromosomal locations and genomic structures. We also described evidence from the cis-regulatory elements and the predicted target genes of miRNAs to support their tissue-specific functional roles to regulate the physiologies of the normal tissues in which they are expressed.


Figures

Figure 1
Figure 1
Scatter plots demonstrate the reproducibility and repeatability of the TaqMan® miRNA assays. We examined the miRNA expression in three brain (A), two testes (B), and two PBMC (C) specimens. Assays that had CT values > 35 were removed from the analysis and correlation of the data were evaluated by Spearman test. Expression of miRNAs was also examined in the same lung specimen at four different time points (T1 to T4) within a five-month time frame to show the repeatability of the data (D).
Figure 2
Figure 2
Unsupervised hierarchical clustering of the normal human tissues based on the variation of miRNA expression correlates with the anatomical locations and physiological functions of the tissues. Normalized CT for each assay was transformed into ΔCT against the average CT of all assays examined and clustered after mean-centering the data for each miRNA but no centering was done for the tissues. A detailed view of the clustering patterns of normal tissues is on the right. The blue bar on the left side of the heat map represented the group of miRNAs primarily expressed in placenta, and the red bar indicated the miRNAs with significant increased expression in epithelial tissues including the gastrointestinal organs. A pseudocolor scale bar represented the fold change relative to the mean of the data for each miRNA.
Figure 3
Figure 3
Unsupervised hierarchical clustering of normal human tissues based on the variation of miRNA abundance demonstrates similar patterns as shown in Figure 2. Normalized CT for each assay was transformed into ΔCT against the average CT of all assays examined and clustered without centering the data. A pseudocolor scale outlines the CT values represented in the heat map. A detailed view of the clustering patterns of normal tissues is on the right.
Figure 4
Figure 4
The abundance of miRNAs in all tissues represented by the estimated average copy numbers of all miRNAs examined, as well as by the average copy numbers of miRNAs in each of the eight most differentially expressed groups. Y-axis is the estimated copy number per cell (assuming 30 pg of total RNA in each cell), and the order of normal tissues at the X-axis is arranged by the clustering patterns shown in the Figure 3.
Figure 5
Figure 5
An enlarge view of the eight groups of most differentially expressed miRNAs. The pseudocolor scale is the same as that in Figure 3.
Figure 6
Figure 6
A flow chart outlines the search strategy used to identify candidate transcription factors that might be associated with the tissue-specific expression of miRNAs in the most differentially expressed groups (A). (B) A screen shot of the "regulogram" map from GenomeTraFac showed a peak for the "Hits" (red circle) upstream to the hsa-miR-129-2 (miR-129b) locus. (C) A screen shot of the transcription factor binding mapfrom GenomeTraFac showed four transcription factors with matching tissue distribution with that of hsa-miR-129b. STAT, STAT5; INSM, INSM1; SORY, SOX5; MOKF, MOK-2 (ZFP239). (D) A screen shot from the GNF database showed the expression of MOK-2 (ZFP239) in normal mouse tissues (no data availablefor human tissues). Two screen shots of the "regulogram" map from GenomeTraFac showed two regions of genomic sequences (red circles) close tothe hsa-miR-302b (E) and hsa-miR-34b (F) loci from which the binding sites for Nkx2-5 and FOXF2, respectively, were identified.
Figure 7
Figure 7
The list of predicted target genes for miR-199a/199b/214 was refined by their expression in 19 normal tissue types extracted fromthe GNF database. Blue bars on the right side of the heat map, genes with brain-specific expression; red bars, genes with PBMC-specific expression. The pseudocolor scale represents the gene expression level that has been transformed to the log2-based ratio to the average signal of all genes extracted.

References

    1. Du T, Zamore PD. microPrimer: the biogenesis and function of microRNA. Development. 2005;132:4645–4652. doi: 10.1242/dev.02070. - DOI - PubMed
    1. Alvarez-Garcia I, Miska EA. MicroRNA functions in animal development and human disease. Development. 2005;132:4653–4662. doi: 10.1242/dev.02073. - DOI - PubMed
    1. Croce CM, Calin GA. miRNAs, cancer, and stem cell division. Cell. 2005;122:6–7. doi: 10.1016/j.cell.2005.06.036. - DOI - PubMed
    1. Chen CZ. MicroRNAs as oncogenes and tumor suppressors. New England Journal of Medicine. 2005;353:1768–1771. doi: 10.1056/NEJMp058190. - DOI - PubMed
    1. Calin GA, Trapasso F, Shimizu M, Dumitru CD, Yendamuri S, Godwin AK, Ferracin M, Bernardi G, Chatterjee D, Baldassarre G, et al. Familial cancer associated with a polymorphism in ARLTS1. N Engl J Med. 2005;352:1667–1676. doi: 10.1056/NEJMoa042280. - DOI - PubMed

Publication types

LinkOut - more resources