. 2007;8(6):R108.
doi: 10.1186/gb-2007-8-6-r108.

Functional coordination of alternative splicing in the mammalian central nervous system

Affiliations

Functional coordination of alternative splicing in the mammalian central nervous system

Matthew Fagnani et al. Genome Biol. 2007.

Abstract

Background: Alternative splicing (AS) functions to expand proteomic complexity and plays numerous important roles in gene regulation. However, the extent to which AS coordinates functions in a cell and tissue type specific manner is not known. Moreover, the sequence code that underlies cell and tissue type specific regulation of AS is poorly understood.

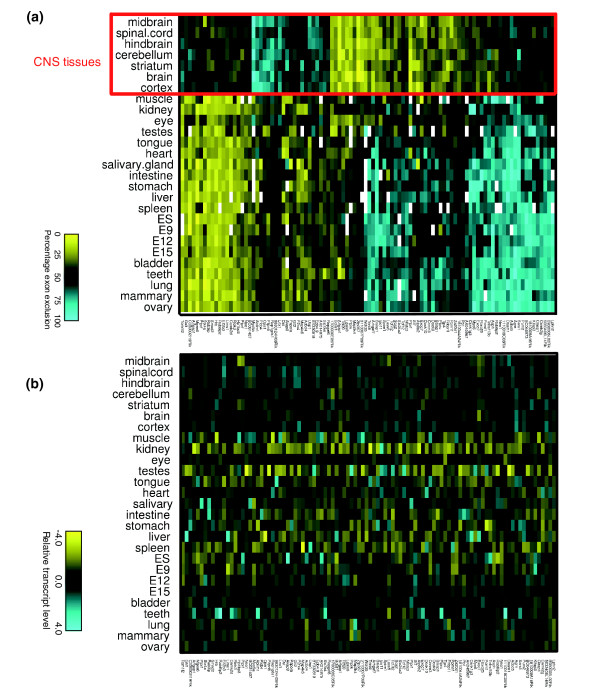
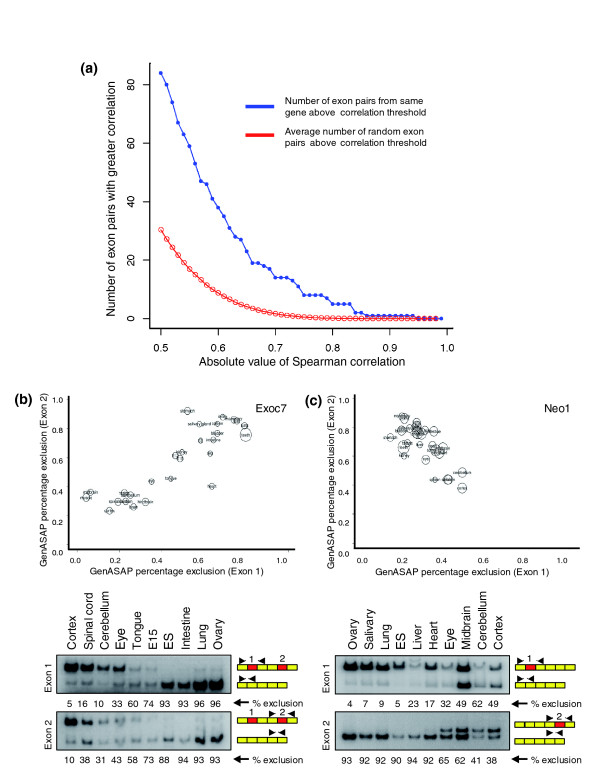
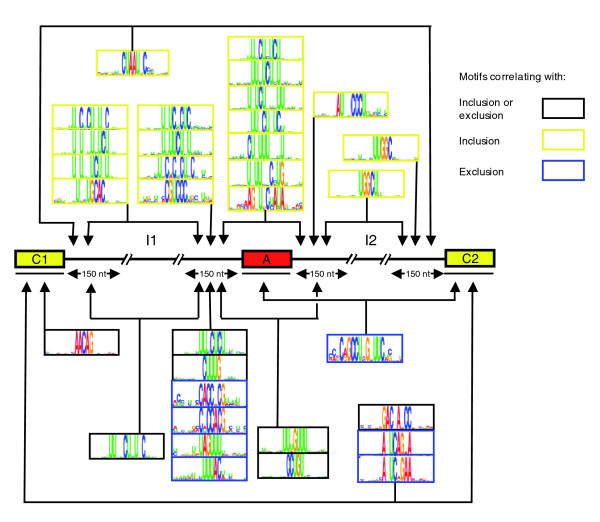
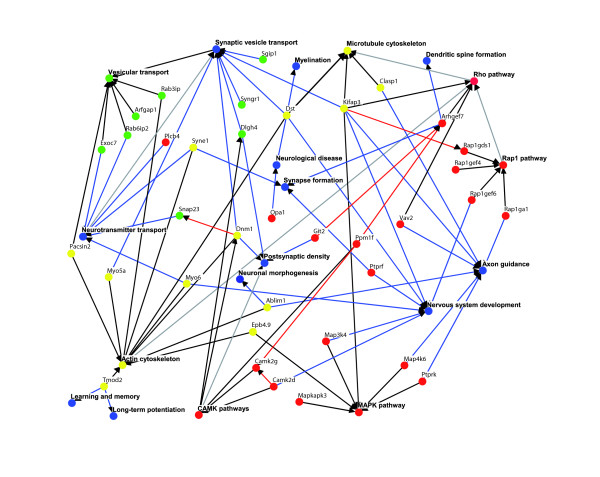
Results: Using quantitative AS microarray profiling, we have identified a large number of widely expressed mouse genes that contain single or coordinated pairs of alternative exons that are spliced in a tissue regulated fashion. The majority of these AS events display differential regulation in central nervous system (CNS) tissues. Approximately half of the corresponding genes have neural specific functions and operate in common processes and interconnected pathways. Differential regulation of AS in the CNS tissues correlates strongly with a set of mostly new motifs that are predominantly located in the intron and constitutive exon sequences neighboring CNS-regulated alternative exons. Different subsets of these motifs are correlated with either increased inclusion or increased exclusion of alternative exons in CNS tissues, relative to the other profiled tissues.

Conclusion: Our findings provide new evidence that specific cellular processes in the mammalian CNS are coordinated at the level of AS, and that a complex splicing code underlies CNS specific AS regulation. This code appears to comprise many new motifs, some of which are located in the constitutive exons neighboring regulated alternative exons. These data provide a basis for understanding the molecular mechanisms by which the tissue specific functions of widely expressed genes are coordinated at the level of AS.


Figures

Figure 1
Figure 1
Identification of widely expressed genes with CNS specific regulation of AS. Microarray profiled genes with single or multiple alternative exons displaying differential alternative splicing (AS) in the central nervous system (CNS) were identified using statistical procedures that control for covariation in transcript levels (see Results and Materials and methods). (a) The top 100 genes with the most significant CNS associated AS levels are hierarchically clustered on both axes, based on their overall AS level similarity across 27 profiled tissues. (b) The corresponding transcript levels of the same genes, displayed in the same order. Color scales representing AS levels (percentage exon exclusion) and transcript levels (z-score scale) are shown below each panel. The z-score represents the number of standard deviations from the mean transcript level (center of the scale, in black) of the given event. Increasingly bright yellow represents lower transcript levels, and increasingly bright blue represents higher transcript levels. White rectangles in the AS clustergram indicate removed GenASAP (Generative Model for the Alternative Splicing Array Platform) values. These values were removed when transcript levels from the same genes (as measured using probes specific for constitutive exons on the microarray) were below the 95th percentile of the negative control probes.
Figure 2
Figure 2
Coordination between AS events belonging to the same genes. (a) The correlation between the alternative splicing (AS) levels of pairs of alternative exons belonging to the same genes was assessed using standard Spearman correlation. The cumulative distribution plot shows the number of exon pairs (y-axis) observed to have an absolute value standard Spearman correlation higher than the value given on the x-axis. The blue curve with closed circles represents the number of observed exon pairs from the same gene above a given correlation threshold. The red curve with open circles is the average number of random pairs above a given correlation threshold, as determined using permutation resampling analysis (see Additional data file 1 [Materials and methods]). Also, representative examples of pairs of alternative exons with correlated splicing levels are shown (b) for a pair of exons with positively correlating inclusion levels from the Exo70 gene and (c) for a pair of exons with negatively correlating inclusion levels from the Neo1 gene. Upper panels show plots comparing the GenASAP percentage exon exclusion levels for each exon in a correlating pair, with the percentage exclusion levels for each exon separately plotted on the y-axis and x-axis. Circle sizes indicate relative transcript levels for the corresponding gene in each tissue shown, with larger circles indicating higher transcript levels. Lower panels show radioactive reverse transcription polymerase chain reaction (RT-PCR) assays performed with primer pairs targeted to constitutive exons flanking each alternative exon in a correlated pair. Percentage exclusion levels for each alternative exon, as measured using a phosphorimager (see Materials and methods), are shown. Additional examples of correlated pairs of exons validated by RT-PCR assays are shown in Additional data file 1 [Figure 2]. ES, embryonic stem cells.
Figure 3
Figure 3
Detection of new motifs in exons and introns that correlate with CNS regulated AS events. Motifs correlating with central nervous system (CNS) associated alternative splicing (AS) levels were detected in exon sequences (C1, A, C2) and intron sequences (I1, I2) using the SeedSearcher algorithm [41]. Ab initio searches for motifs were performed in the individual exon and intron sequences, and in concatenations of intron/exon sequences. Motifs enriched in these locations, as indicated by lines with arrowheads, are correlated with either increased inclusion (yellow boxes), increased exclusion (blue boxes), or a change in inclusion (black boxes), respectively.
Figure 4
Figure 4
Network diagram comprising genes and functional processes associated with regulated AS events in the CNS. Experimental evidence supporting interactions, pathway and functional relationships among genes with microarray detected central nervous system (CNS) specific alternative splicing (AS) events was retrieved from the literature and from the Online Predicted Human Interaction Database [45], and used to construct a network diagram using the Osprey program [46]. Yellow nodes denote cytoskeletal pathways/genes, green nodes denote vesicle-mediated transport pathways/genes, red nodes denote signaling pathways/genes, and blue nodes denote CNS functions. Red edges denote protein-protein interactions, black edges denote gene-pathway associations, blue edges denote gene-CNS function associations, and gray edges denote pathway-pathway or pathway-CNS function associations. Pathways and CNS functions are in bold letters. Gene names are the NCBI Entrez Gene standard gene symbols.

References

    1. Smith CW, Valcarcel J. Alternative pre-mRNA splicing: the logic of combinatorial control. Trends Biochem Sci. 2000;25:381–388. doi: 10.1016/S0968-0004(00)01604-2. - DOI - PubMed
    1. Graveley BR. Alternative splicing: increasing diversity in the proteomic world. Trends Genet. 2001;17:100–107. doi: 10.1016/S0168-9525(00)02176-4. - DOI - PubMed
    1. Matlin AJ, Clark F, Smith CW. Understanding alternative splicing: towards a cellular code. Nat Rev Mol Cell Biol. 2005;6:386–398. doi: 10.1038/nrm1645. - DOI - PubMed
    1. Blencowe BJ. Alternative splicing: new insights from global analyses. Cell. 2006;126:37–47. doi: 10.1016/j.cell.2006.06.023. - DOI - PubMed
    1. Lareau LF, Green RE, Bhatnagar RS, Brenner SE. The evolving roles of alternative splicing. Curr Opin Struct Biol. 2004;14:273–282. doi: 10.1016/j.sbi.2004.05.002. - DOI - PubMed

Publication types