

Meta-analysis of polyploid cotton QTL shows unequal contributions of subgenomes to a complex network of genes and gene clusters implicated in lint fiber development
- PMID: 17565937
- PMCID: PMC1950656
- DOI: 10.1534/genetics.107.074518
Meta-analysis of polyploid cotton QTL shows unequal contributions of subgenomes to a complex network of genes and gene clusters implicated in lint fiber development
Abstract
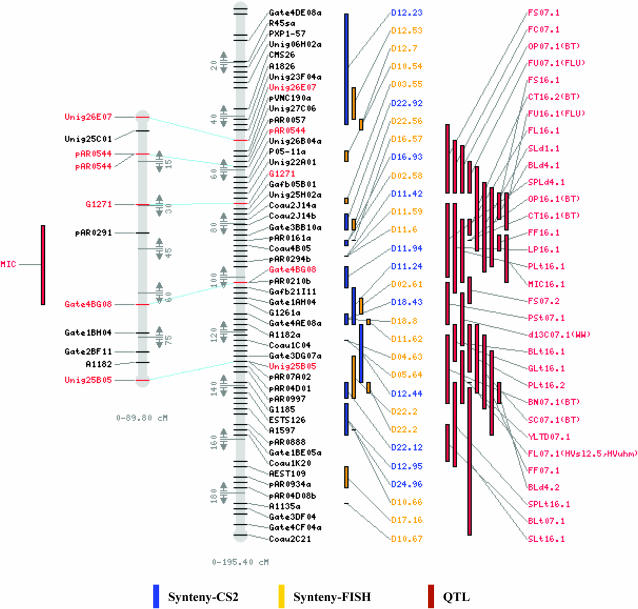
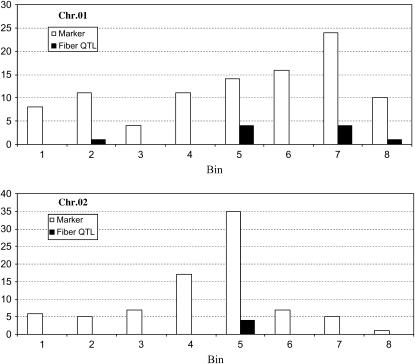
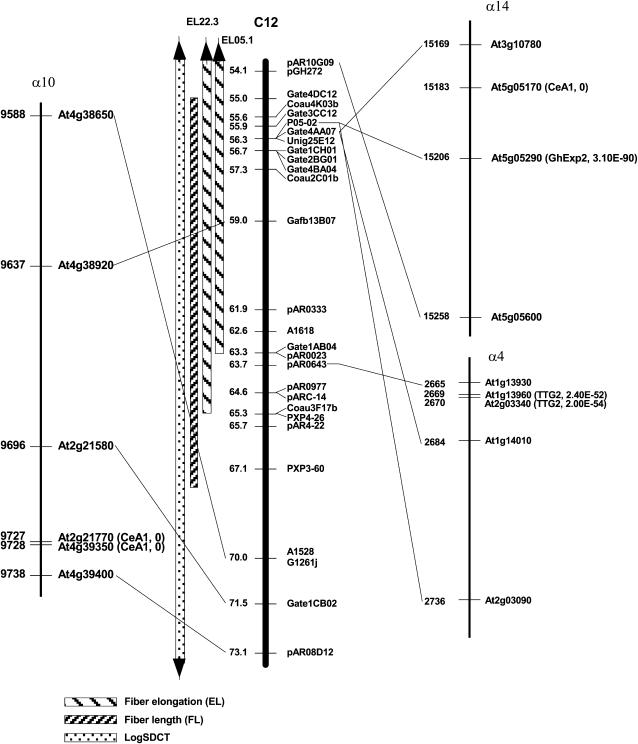
QTL mapping experiments yield heterogeneous results due to the use of different genotypes, environments, and sampling variation. Compilation of QTL mapping results yields a more complete picture of the genetic control of a trait and reveals patterns in organization of trait variation. A total of 432 QTL mapped in one diploid and 10 tetraploid interspecific cotton populations were aligned using a reference map and depicted in a CMap resource. Early demonstrations that genes from the non-fiber-producing diploid ancestor contribute to tetraploid lint fiber genetics gain further support from multiple populations and environments and advanced-generation studies detecting QTL of small phenotypic effect. Both tetraploid subgenomes contribute QTL at largely non-homeologous locations, suggesting divergent selection acting on many corresponding genes before and/or after polyploid formation. QTL correspondence across studies was only modest, suggesting that additional QTL for the target traits remain to be discovered. Crosses between closely-related genotypes differing by single-gene mutants yield profoundly different QTL landscapes, suggesting that fiber variation involves a complex network of interacting genes. Members of the lint fiber development network appear clustered, with cluster members showing heterogeneous phenotypic effects. Meta-analysis linked to synteny-based and expression-based information provides clues about specific genes and families involved in QTL networks.
Figures
References
-
- Arcade, A., A. Labourdette, M. Falque, B. Mangin, F. Chardon et al., 2004. BioMercator: integrating genetic maps and QTL towards discovery of candidate genes. Bioinformatics 20: 2324–2326. - PubMed
-
- Benton, M. J., 1993. The Fossil Record, Ed. 2. Chapman & Hall, New York.
-
- Bowers, J. E., B. A. Chapman, J. Rong and A. H. Paterson, 2003. Unravelling angiosperm genome evolution by phylogenetic analysis of chromosomal duplication events. Nature 422: 433–438. - PubMed
-
- Calabrese, P. P., S. Chakravarty and T. J. Vision, 2003. Fast identification and statistical evaluation of segmental homologies in comparative maps. Bioinformatics 19(Suppl. 1): i74–i80. - PubMed
-
- Chee, P., X. Draye, C. Jiang, L. Decanini, T. Delmonte et al., 2005. a Molecular dissection of interspecific variation between Gossypium hirsutum and G. barbadense (cotton) by a backcross-self approach: I. Fiber elongation. Theor. Appl. Genet. 111: 757–763. - PubMed
Publication types
MeSH terms
Substances
LinkOut - more resources
Full Text Sources
Other Literature Sources
